
Page 14 - JSOM Fall 2022
P. 14
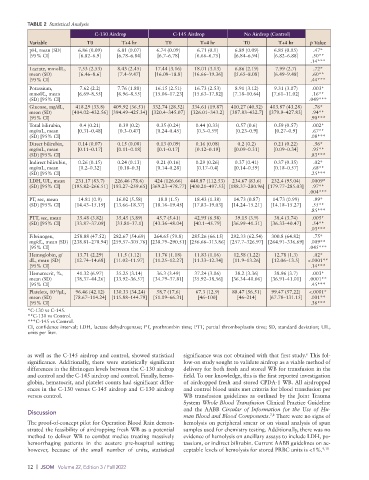
TABLE 2 Statistical Analysis
C-130 Airdrop C-145 Airdrop No Airdrop (Control)
Variable T0 T+4 hr T0 T+4 hr T0 T+4 hr p Value
pH, mean (SD) 6.86 (0.09) 6.81 (0.07) 6.74 (0.09) 6.71 (0.1) 6.89 (0.09) 6.85 (0.05) .47*
[95% CI] [6.82–6.9] [6.78–6.84] [6.7–6.78] [6.66–6.75] [6.84–6.94] [6.82–6.88] .50**
.14***
Lactate, mmol/L, 7.53 (2.53) 8.43 (2.45) 17.44 (3.16) 18.01 (3.13) 6.86 (2.19) 7.99 (2.7) .72*
mean (SD) [6.46–8.6] [7.4–9.47] [16.08–18.8] [16.66–19.36] [5.65–8.08] [6.49–9.48] .60**
[95% CI] .44***
Potassium, 7.62 (2.2) 7.76 (1.88) 16.15 (2.51) 16.73 (2.53) 8.91 (3.12) 9.31 (3.07) .003*
mmol/L, mean [6.69–8.55] [6.96–8.55] [15.06–17.23] [15.63–17.82] [7.18–10.64] [7.61–11.02] .16**
(SD) [95% CI] .049***
Glucose, mg/dL, 418.29 (33.8) 409.92 (36.53) 332.74 (28.52) 334.61 (19.87) 410.27 (40.52) 403.87 (43.28) .76*
mean (SD) [404.02–432.56] [394.49–425.34] [320.4–345.07] [326.01–343.2] [387.83–432.7] [379.9–427.83] .94**
[95% CI] .90***
Total bilirubin, 0.4 (0.21) 0.39 (0.2) 0.35 (0.24) 0.44 (0.33) 0.57 (0.6) 0.59 (0.57) .002*
mg/mL, mean [0.31–0.48] [0.3–0.47] [0.24–0.45] [0.3–0.59] [0.23–0.9] [0.27–0.9] .67**
(SD) [95% CI] .08***
Direct bilirubin, 0.14 (0.07) 0.15 (0.08) 0.13 (0.09) 0.16 (0.08) 0.2 (0.2) 0.21 (0.22) .56*
mg/mL, mean [0.11–0.17] [0.11–0.18] [0.1–0.17] [0.12–0.19] [0.09–0.31] [0.09–0.34] .95**
(SD) [95% CI] .83***
Indirect bilirubin, 0.26 (0.15) 0.24 (0.13) 0.21 (0.16) 0.29 (0.26) 0.37 (0.41) 0.37 (0.35) .02*
mg/mL, mean [0.2–0.32] [0.18–0.3] [0.14–0.28] [0.17–0.4] [0.14–0.59] [0.18–0.57] .68**
(SD) [95% CI] .25***
LDH, U/L, mean 231.17 (83.7) 226.46 (78.6) 424 (126.66) 448.87 (112.53) 234.67 (83.6) 232.4 (95.04) .0009*
(SD) [95% CI] [195.82–266.51] [193.27–259.65] [369.23–478.77] [400.21–497.53] [188.37–280.96] [179.77–285.03] .97**
.004***
PT, sec, mean 14.81 (0.9) 16.02 (5.58) 18.8 (1.5) 18.43 (1.38) 14.73 (0.87) 14.73 (0.99) .99*
(SD) [95% CI] [14.43–15.19] [13.66–18.37] [18.16–19.45] [17.83–19.03] [14.24–15.21] [14.18–15.27] .55**
.85***
PTT, sec, mean 35.48 (3.82) 35.45 (3.89) 45.7 (5.41) 42.95 (6.58) 39.15 (3.9) 38.4 (3.74) .005*
(SD) [95% CI] [33.87–37.09] [33.81–37.1] [43.36–48.04] [40.1–45.79] [36.99–41.31] [36.33–40.47] .54**
.03***
Fibrinogen, 258.88 (47.52) 282.67 (54.69) 264.65 (59.8) 285.26 (66.15) 292.33 (62.54) 300.8 (64.82) .75*
mg/dL, mean (SD) [238.81–278.94] [259.57–305.76] [238.79–290.51] [256.66–313.86] [257.7–326.97] [264.91–336.69] .009**
[95% CI] .045***
Hemoglobin, g/ 13.71 (2.29) 11.5 (1.12) 11.76 (1.18) 11.83 (1.16) 12.58 (1.22) 12.78 (1.3) .02*
dL, mean (SD) [12.74–14.68] [11.02–11.97] [11.25–12.27] [11.33–12.34] [11.9–13.26] [12.06–13.5] <.0001**
[95% CI] .14***
Hematocrit, %, 41.32 (6.97) 35.25 (3.14) 36.3 (3.49) 37.24 (3.06) 38.2 (3.36) 38.96 (3.7) .003*
mean (SD) [38.37–44.26] [33.92–36.57] [34.79–37.81] [35.92–38.56] [36.34–40.06] [36.91–41.01] .0001**
[95% CI] .45***
Platelets, 10 /µL, 96.46 (42.12) 130.33 (34.24) 58.7 (17.6) 67.3 (12.9) 88.47 (56.51) 99.47 (57.22) <.0001*
3
mean (SD) [78.67–114.24] [115.88–144.79] [51.09–66.31] [46–100] [46–214] [67.78–131.15] .001**
[95% CI] .36***
*C130 vs C145.
**C130 vs Control.
***C145 vs Control.
CI, confidence interval; LDH, lactate dehydrogenase; PT, prothrombin time; PTT, partial thromboplastin time; SD, standard deviation; U/L,
units per liter.
as well as the C145 airdrop and control, showed statistical significance was not obtained with that first study. This fol
6
significance. Additionally, there were statistically significant lowon study sought to validate airdrop as a viable method of
differences in the fibrinogen levels between the C130 airdrop delivery for both fresh and stored WB for transfusion in the
and control and the C145 airdrop and control. Finally, hemo field. To our knowledge, this is the first reported investigation
globin, hematocrit, and platelet counts had significant differ of airdropped fresh and stored CPDA1 WB. All airdropped
ences in the C130 versus C145 airdrop and C130 airdrop and control blood units met criteria for blood transfusion per
versus control. WB transfusion guidelines as outlined by the Joint Trauma
System Whole Blood Transfusion Clinical Practice Guideline
and the AABB Circular of Information for the Use of Hu-
Discussion
man Blood and Blood Components. There were no signs of
7,8
The proofofconcept pilot for Operation Blood Rain demon hemolysis on peripheral smear or on visual analysis of spun
strated the feasibility of airdropping fresh WB as a potential samples used for chemistry testing. Additionally, there was no
method to deliver WB to combat medics treating massively evidence of hemolysis on ancillary assays to include LDH, po
hemorrhaging patients in the austere prehospital setting; tassium, or indirect bilirubin. Current AABB guidelines on ac
however, because of the small number of units, statistical ceptable levels of hemolysis for stored PRBC units is <1%. 9,10
12 | JSOM Volume 22, Edition 3 / Fall 2022