
Page 13 - JSOM Fall 2022
P. 13
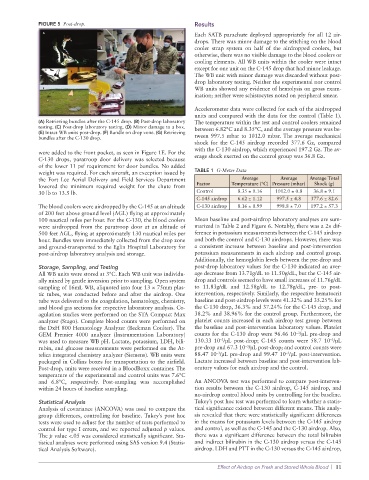
FIGURE 5 Post-drop. Results
Each SATB parachute deployed appropriately for all 12 air
drops. There was minor damage to the stitching on the blood
cooler strap system on half of the airdropped coolers, but
other wise, there was no visible damage to the blood coolers or
cooling elements. All WB units within the cooler were intact
except for one unit on the C145 drop that had minor leakage.
The WB unit with minor damage was discarded without post
drop laboratory testing. Neither the experimental nor control
WB units showed any evidence of hemolysis on gross exam
ination; neither were schistocytes noted on peripheral smear.
Accelerometer data were collected for each of the airdropped
units and compared with the data for the control (Table 1).
(A) Retrieving bundles after the C145 drop. (B) Postdrop laboratory The temperature within the test and control coolers remained
testing. (C) Postdrop laboratory testing. (D) Minor damage to a box. between 6.82°C and 8.35°C, and the average pressure was be
(E) Intact WB units postdrop. (F) Bundle on drop zone. (G) Retrieving
bundles after the C130 drop. tween 997.5 mbar to 1012.0 mbar. The average mechanical
shock for the C145 airdrop recorded 377.6 Gz, compared
with the C130 airdrop, which experienced 197.2 Gz. The av
were added to the front pocket, as seen in Figure 1E. For the
C130 drops, paratroop door delivery was selected because erage shock exerted on the control group was 36.8 Gz.
of the lower 11 psf requirement for door bundles. No added
weight was required. For each aircraft, an exception issued by TABLE 1 G-Meter Data
the Fort Lee Aerial Delivery and Field Services Department Average Average Average Total
lowered the minimum required weight for the chute from Factor Temperature (°C) Pressure (mbar) Shock (g)
30 lb to 13.5 lb. Control 8.35 ± 0.16 1012.0 ± 0.8 36.8 ± 9.1
C145 airdrop 6.62 ± 1.12 997.5 ± 4.8 377.6 ± 82.6
The blood coolers were airdropped by the C145 at an altitude C130 airdrop 8.16 ± 0.99 998.8 ± 7.0 197.2 ± 57.3
of 200 feet above ground level (AGL) flying at approximately
100 nautical miles per hour. For the C130, the blood coolers Mean baseline and postairdrop laboratory analyses are sum
were airdropped from the paratroop door at an altitude of marized in Table 2 and Figure 6. Notably, there was a 2× dif
500 feet AGL, flying at approximately 130 nautical miles per ference in potassium measurements between the C145 airdrop
hour. Bundles were immediately collected from the drop zone and both the control and C130 airdrops. However, there was
and groundtransported to the Eglin Hospital Laboratory for a consistent increase between baseline and postintervention
postairdrop laboratory analysis and storage. potassium measurements in each airdrop and control group.
Additionally, the hemoglobin levels between the predrop and
Storage, Sampling, and Testing postdrop laboratory values for the C130 indicated an aver
All WB units were stored at 3°C. Each WB unit was individu age decrease from 13.71g/dL to 11.50g/dL, but the C145 air
ally mixed by gentle inversion prior to sampling. Open system drop and controls seemed to have small increases of 11.76g/dL
sampling of 16mL WB, aliquoted into four 13 × 75mm plas to 11.83g/dL and 12.58g/dL to 12.78g/dL, pre to post
tic tubes, was conducted before and after the airdrop. One intervention, respectively. Similarly, the respective hematocrit
tube was delivered to the coagulation, hematology, chemistry, baseline and postairdrop levels were 41.32% and 35.25% for
and blood gas sections for respective laboratory analysis. Co the C130 drop, 36.3% and 37.24% for the C145 drop, and
agulation studies were performed on the STA Compact Max 38.2% and 38.96% for the control group. Furthermore, the
analyzer (Stago). Complete blood counts were performed on platelet counts increased in each airdrop test group between
the DxH 800 Hematology Analyzer (Beckman Coulter). The the baseline and postintervention laboratory values. Platelet
–3
GEM Premier 4000 analyzer (Instrumentation Laboratory) counts for the C130 drop were 96.46 10 /µL predrop and
was used to measure WB pH. Lactate, potassium, LDH, bili 130.33 10 /µL postdrop; C145 counts were 58.7 10 /µL
–3
–3
–3
rubin, and glucose measurements were performed on the At predrop and 67.3 10 /µL postdrop; and control counts were
–3
–3
telica integrated chemistry analyzer (Siemens). WB units were 88.47 10 /µL predrop and 99.47 10 /µL postintervention.
packaged in Collins boxes for transportation to the airfield. Lactate increased between baseline and postintervention lab
Postdrop, units were received in a BloodBoxx container. The oratory values for each airdrop and the control.
temperature of the experimental and control units was 7.6°C
and 6.8°C, respectively. Postsampling was accomplished An ANCOVA test was performed to compare postinterven
within 24 hours of baseline sampling. tion results between the C130 airdrop, C145 airdrop, and
no airdrop control blood units by controlling for the baseline.
Statistical Analysis Tukey’s post hoc test was performed to learn whether a statis
Analysis of covariance (ANCOVA) was used to compare the tical significance existed between different means. This analy
group differences, controlling for baseline. Tukey’s post hoc sis revealed that there were statistically significant differences
tests were used to adjust for the number of tests performed to in the means for potassium levels between the C145 airdrop
control for type I errors, and we reported adjusted p values. and control, as well as the C145 and the C130 airdrop. Also,
The p value <.05 was considered statistically significant. Sta there was a significant difference between the total bilirubin
tistical analyses were performed using SAS version 9.4 (Statis and indirect bilirubin in the C130 airdrop versus the C145
tical Analysis Software). airdrop. LDH and PTT in the C130 versus the C145 airdrop,
Effect of Airdrop on Fresh and Stored Whole Blood | 11