
Page 101 - JSOM Winter 2024
P. 101
Statistical Analyses remained unaffected by the training. Participants showed a
Statistical analyses were performed using Statistica 10.0 notable reduction in COG after 1000-m sCS in the standing
2
( StatSoft, Inc., Tulsa, OK). A general linear model (GLM) with (F (2.42) =5.35; P<.05, η =0.12) and kneeling (F (2.42) =4.15; P=.05,
2
repeated measures and a Bonferonni post-hoc comparison was η =0.10) positions. The reduction remained consistent before
performed. For all analyses, we checked data sphericity with and after the training period.
the Mauchly test. Under no circumstances was there a viola-
tion of sphericity; therefore, the Greinhouse-Geisser correction The shots showed greater deviation from the horizontal axis
was not used. We calculated the partial effect size η as a mea- after 1000-m sCS in both the standing (F (2.42) =53.10; P<.01,
2
2
2
sure of the magnitude of the effect, which takes values between η =0.56) and kneeling (F (2.42) =58.81; P<.01, η = 0.59) posi-
0 and 1: 0.02=small, 0.13=moderate, and >0.26=large effect tions. Similarly, the shots had a significantly greater deviation
size. All data are presented as mean and SD, unless otherwise from the vertical axis after 1000-m sCS in both the standing
2
indicated. We set the significance level at P≤.05. (F (2,42) =99.69; P<.01, η =0.71) and kneeling (F (2.42) =15.03;
2
P<.01, η =0.27) positions. These differences in deviation in
both axes persisted after the training period.
Results
The Effect of Training on 1000-m sCS Performance In the standing position, the holding time and total time were
2
Both the SF and UE groups improved in 1000-m sCS perfor- reduced after 1000-m sCS (F (2.42) =23.55; P<.01, η =0.36 for
mance (F (2,42) =25.24; P<.01, η =0.38), whereas the CG did not. holding time and F (2.42) =16.15; P<.01, η =0.28 for total time).
2
2
The improvement of the SF group was 134 (SD 115) seconds, No differences were observed in holding or total time in the
while that of the UE group was 111 (SD 57) seconds (Table kneeling position. Similarly, the holding time and total time
1) without significant differences between the experimental were not affected by the training regimen.
groups. We observed no significant differences in HR, blood
lactate, and RPE immediately after the 1000-m sCS (Table 1). The intervals between shots decreased significantly after
1000-m sCS in both positions (F (2.42) =10.14; P<.01, η =0.20
2
The Effect of Training on Shooting Performance and F (2.42) =6.19; P<.05, η =0.13 for standing and kneeling,
2
The shooting variables are shown in Table 2 (standing position) respectively). Training reduced the interval in both positions
2
2
and Table 3 (kneeling position). Shooting in both positions (F (2.42) =17.34; P<.01, η =0.45 and F (2.42) =4.37; P=.02, η =0.17
TABLE 1 Physical Performance Measures in 1000-m Surface Combat Swimming, Before and After the 4-Week Training Period, by Group
Period, mean (SD)
Before training After training
CG SF UE CG SF UE
Performance, s 1879 (174) 1908 (268) 1831 (183) 1847 (197) 1774 (153)* 1720 (125)*
HR, beats/ min 175 (11) 175 (13) 174 (13) 173 (12 179 (11) 177 (10)
La, mmol/L 7.4 (3.6) 6.7 (1.8) 7.2 (2.8) 7.0 (2.7) 7.3 (2.4) 8.7 (2.4)
RPE, 10-point scale 9 (1) 9 (1) 8 (1) 9 (1) 9 (1) 8 (1)
*Statistically significant differences before and after training period, P<.05.
CG = control group; HR = heart rate; La = blood lactate; RPE = rating of perceived exertion; SF = swimsuit and fins; UE = uniform and equipment.
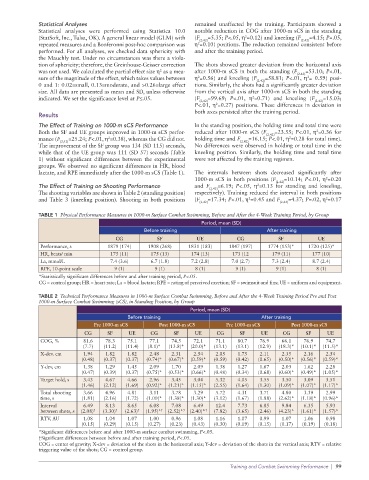
TABLE 2 Technical Performance Measures in 1000-m Surface Combat Swimming, Before and After the 4-Week Training Period Pre and Post
1000-m Surface Combat Swimming (sCS), in Standing Position, by Group
Period, mean (SD)
Before training After training
Pre 1000-m sCS Post 1000-m sCS Pre 1000-m sCS Post 1000-m sCS
CG SF UE CG SF UE CG SF UE CG SF UE
COG, % 81.6 78.3 75.1 77.1 74.5 72.1 71.1 80.7 76.9 66.1 76.9 74.7
(7.7) (11.2) (11.4) (8.1)* (13.8)* (20.0)* (13.1) (13.1) (12.9) (18.3)* (10.1)* (11.5)*
X-dev. cm 1.94 1.82 1.82 2.48 2.31 2.54 2.05 1.75 2.11 2.35 2.16 2.54
(0.48) (0.37) (0.37) (0.74)* (0.67)* (0.59)* (0.59) (0.42) (0.65) (0.50)* (0.56)* (0.59)*
Y-dev, cm 1.38 1.29 1.45 2.09 1.70 2.09 1.38 1.27 1.67 2.03 1.62 2.28
(0.47) (0.39) (0.37) (0.75)* (0.53)* (0.66)* (0.48) (0.34) (0.68) (0.60)* (0.49)* (1.05)*
Target hold, s 3.43 4.67 4.66 2.96 3.45 3.04 5.32 4.05 3.55 3.50 3.09 3.51
(1.46) (2.12) (1.69) (0.92)* (1.21)* (1.15)* (2.55) (1.64) (1.30) (1.09)* (1.07)* (1.17)*
Total shooting 3.66 4.96 4.81 3.11 3.78 3.29 5.72 4.31 3.71 4.80 3.39 2.99
time, s (1.81) (2.16) (1.72) (1.00)* (1.38)* (1.30)* (3.12) (1.67) (1.88) (2.62)* (1.18)* (0.96)*
Interval 6.49 8.13 8.65 6.08 7.08 6.49 12.4 7.73 6.85 9.84 6.35 5.93
between shots, s (2.08) † (3.30) † (2.63) † (1.95)* † (2.52)* † (2.40)* † (7.82) (3.65) (2.46) (4.23)* (1.61)* (1.57)*
RTV, AU 1.08 1.04 1.07 1.00 0.96 1.08 1.16 1.07 0.99 1.07 1.06 0.98
(0.15) (0.29) (0.15) (0.27) (0.23) (0.43) (0.30) (0.19) (0.15) (0.17) (0.19) (0.18)
*Significant differences before and after 1000-m surface combat swimming, P<.05.
†Significant differences between before and after training period, P<.05.
COG = center of gravity; X-dev = deviation of the shots in the horizontal axis; Y-dev = deviation of the shots in the vertical axis; RTV = relative
triggering value of the shots; CG = control group.
Training and Combat Swimming Performance | 99