
Page 101 - JSOM Winter 2023
P. 101
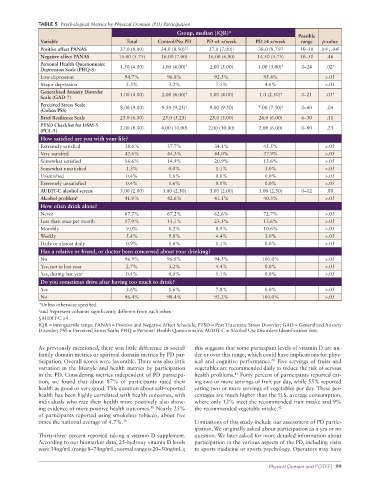
TABLE 5  Psychological Metrics by Physical Domain (PD) Participation
                                                           Group, median (IQR)*
                                                                                                   Possible
              Variable                    Total      Control/No PD  PD <4 x/week     PD ≥4 x/week  range  p-value
              Positive affect PANAS     37.0 (8.00)   34.0 (8.50) †‡  37.0 (7.00) †  38.0 (8.75 )‡  10–50  .04 , .04 ‡
                                                                                                            †
              Negative affect PANAS     15.00 (5.75)  16.00 (7.00)   16.00 (6.00)    14.50 (5.75)  10–50    .46
              Personal Health Questionnaire                   †                              †                †
              Depression Scale (PHQ-8)   1.50 (4.00)  3.00 (4.00)     2.00 (5.00)    1.00 (3.00)    0–24   .02
              Low depression              94.7%         96.8%          92.5%           95.4%               >.05
              Major depression            5.3%          3.2%           7.5%             4.6%               >.05
              Generalized Anxiety Disorder   1.00 (4.00)  2.00 (4.00) †  1.00 (4.00)  1.0 (2.50) †  0–21   .03 †
              Scale (GAD-7)
              Perceived Stress Scale                          †                              †
              (Cohen PSS)               8.00 (9.00)   9.50 (9.25)     9.00 (9.50)    7.00 (7.50)    0–40    .04
              Brief Resilience Scale    25.0 (6.00)   25.0 (5.25)     25.0 (5.00)     26.0 (6.00)   6–30    .11
              PTSD Checklist for DSM-5
              (PCL-5)                   2.00 (8.00)   4.00 (10.00)   2.00 (10.00)     2.00 (6.00)   0–80    .23
              How satisfied are you with your life?
              Extremely satisfied         38.6%         37.7%          34.1%           45.5%               >.05
              Very satisfied              42.6%         44.3%          44.0%           37.9%               >.05
              Somewhat satisfied          16.6%         14.8%          20.9%           13.6%               >.05
              Somewhat unsatisfied        1.3%          0.0%           1.1%             3.0%               >.05
              Unsatisfied                 0.4%          1.6%           0.0%             0.0%               >.05
              Extremely unsatisfied       0.4%          1.6%           0.0%             0.0%               >.05
              AUDIT-C alcohol screen    3.00 (2.00)   3.00 (2.50)     3.00 (2.00)     3.00 (2.50)   0–12    .80
              Alcohol problem §           41.0%         42.6%          41.1%           40.3%               >.05
              How often drink alone?
              Never                       67.7%         67.2%          62.6%           72.7%               >.05
              Less than once per month    17.0%         13.1%          23.1%           13.6%               >.05
              Monthly                     9.0%          8.2%           8.9%            10.6%               >.05
              Weekly                      5.4%          9.8%           4.4%             3.0%               >.05
              Daily or almost daily       0.9%          1.6%           1.1%             0.0%               >.05
              Has a relative or friend, or doctor been concerned about your drinking?
              No                          96.9%         96.8%          94.5%           100.0%              >.05
              Yes, not in last year       2.7%          3.2%           4.4%             0.0%               >.05
              Yes, during last year       0.4%          0.0%           1.1%             0.0%               >.05
              Do you sometimes drive after having too much to drink?
              Yes                         3.6%          1.6%           7.8%             0.0%               >.05
              No                          96.4%         98.4%          92.2%           100.0%              >.05
              *Unless otherwise specified.
              † and  represent columns significantly different from each other.
                 ‡
              §AUDIT-C ≥4.
              IQR = interquartile range; PANAS = Positive and Negative Affect Schedule; PTSD = Post Traumatic Stress Disorder; GAD = Generalized Anxiety
              Disorder; PSS = Perceived Stress Scale; PHQ = Personal Health Questionnaire; AUDIT-C = Alcohol Use Disorders Identification Test.

              As previously mentioned, there was little difference in social/  this suggests that some participant levels of vitamin D are un-
              family domain metrics or spiritual domain metrics by PD par-  der or over this range, which could have implications for phys-
                                                                                          40
              ticipation. Overall scores were favorable. There was also little   ical and cognitive performance.  Five servings of fruits and
              variation in the lifestyle and health metrics by participation   vegetables are recommended daily to reduce the risk of serious
                                                                              41
              in the PD. Considering metrics independent of PD participa-  health problems.  Forty percent of participants reported eat-
              tion, we found that about 87% of participants rated their   ing two or more servings of fruit per day, while 55% reported
              health as good or very good. This question about self-reported   eating two or more servings of vegetables per day. These per-
              health has been highly correlated with health outcomes, with   centages are much higher than the U.S. average consumption,
              individuals who rate their health more positively also show-  where only 12% meet the recommended fruit intake and 9%
                                                  38
              ing evidence of more positive health outcomes.  Nearly 25%   the recommended vegetable intake. 42
              of participants reported using smokeless tobacco, about five
              times the national average of 4.7%. 39             Limitations of this study include our assessment of PD partic-
                                                                 ipation. We originally asked about participation as a yes or no
              Thirty-three percent reported taking a vitamin D supplement.   question. We later asked for more detailed information about
              According to our biomarker data, 25-hydroxy vitamin D levels   participation in the various aspects of the PD, including visits
              were 34ng/mL (range 8–74ng/mL; normal range is 20–50ng/mL);    to sports medicine or sports psychology. Operators may have

                                                                                         Physical Domain and POTFF |  99