
Page 98 - JSOM Winter 2023
P. 98
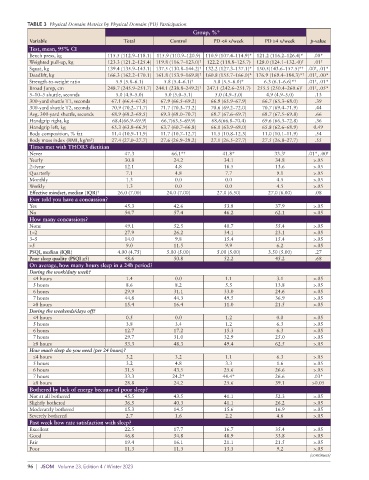
TABLE 3  Physical Domain Metrics by Physical Domain (PD) Participation
                                                                Group, %*
           Variable                      Total           Control       PD <4 x/week     PD ≥4 x/week   p-value
           Test, mean, 95% CI
           Bench press, kg          115.5 (112.9–118.1)  115.9 (110.9–120.9)  110.9 (107.4–114.9)* 121.2 (116.2–126.4)*  .00*
           Weighted pull-up, kg     123.3 (121.2–125.4) 119.8 (116.7–123.0) †  122.2 (118.8–125.7)  128.0 (124.1–132.-0) †  .01 †
           Squat, kg                139.4 (135.9–143.1) 137.5 (130.8–144.2) †  132.2 (127.3–137.1)* 150.5(143.6–157.5)* †  .00 , .01*
                                                                                                        †
                                                                                                        †
           Deadlift, kg             166.3 (162.2–170.1) 161.8 (153.9–169.8) †  160.8 (155.7–166.0)* 176.9 (169.4–184.3)* †  .01 , .00*
           Strength-to-weight ratio    5.9 (5.8–6.1)   5.8 (5.4–6.1) †  5.8 (5.5–6.0)*  6.3 (6.1–6.6)* †  .01 , .01*
                                                                                                        †
                                                                                                        †
           Broad Jump, cm           248.7 (245.9–251.7) 244.1 (238.8–249.2) †  247.1 (242.6–251.7)  255.5 (250.4–260.6) †  .01 , .05*
           5–10–5 shuttle, seconds     5.0 (4.9–5.0)   5.0 (5.0–5.1)   5.0 (4.9–5.0)    4.9 (4.9–5.0)   .13
           300-yard shuttle T1, seconds  67.1 (66.4–67.8)  67.9 (66.5–69.2)  66.9 (65.9–67.9)  66.7 (65.3–68.0)  .39
           300-yard shuttle T2, seconds  70.9 (70.2–71.7)  71.7 (70.3–73.2)  70.6 (69.2–72.0)  70.7 (69.4–71.9)  .44
           Avg. 300-yard shuttle, seconds  68.9 (68.2–69.5)  69.3 (68.0–70.7)  68.7 (67.6–69.7)  68.7 (67.5–69.8)  .66
           Handgrip right, kg         68.4(66.9–69.9)  66.7(63.5–69.9)  68.6(66.8–70.4)  69.6 (66.3–72.8)  .36
           Handgrip left, kg         65.3 (63.8–66.9)  63.7 (60.7–66.8)  66.0 (63.9–68.0)  65.8 (62.6–68.9)  0.49
           Body composition, % fat   11.4 (10.9–11.9)  11.7 (10.7–12.7)  11.5 (10.8–12.3)  11.0 (10.1–11.9)  .54
           Body mass index (BMI, kg/m )  27.4 (27.0–27.7)  27.6 (26.9–28.2)  27.1 (26.5–27.7)  27.5 (26.8–27.7)  .55
                               2
           Times met with THOR3 dietitian
           Never                          47.3           66.1* †          41.8*            33.3 †     .01*, .00 †
           Yearly                         30.8            24.2            34.1             34.8        >.05
           2×/year                        12.1            4.8             16.5             13.6        >.05
           Quarterly                      7.1             4.8              7.7             9.1         >.05
           Monthly                        1.3             0.0              0.0             4.5         >.05
           Weekly                         1.3             0.0              0.0             4.5         >.05
           Effective mindset, median (IQR) ‡  26.0 (7.00)  24.0 (7.00)  27.0 (6.50)      27.0 (6.00)    .08
           Ever told you have a concussion?
           Yes                            45.3            42.6            53.8             37.9        >.05
           No                             54.7            57.4            46.2             62.1        >.05
           How many concussions?
           None                           49.1            52.5            40.7             55.4        >.05
           1–2                            27.9            26.2            34.1             23.1        >.05
           3–5                            14.0            9.8             15.4             15.4        >.05
           >5                             9.0             11.5             9.9             6.2         >.05
           PSQI, median (IQR)          4.00 (4.75)     5.00 (5.00)      5.00 (5.00)      3.50 (5.00)    .27
           Poor sleep quality (PSQI >5)   48.6            50.8            52.2             45.2         .68
           On average, how many hours sleep in a 24h period?
           During the work/duty week?
            ≤4 hours                      1.4             0.0              1.1             3.1         >.05
            5 hours                       8.6             8.2              5.5             13.8        >.05
            6 hours                       29.9            31.1            33.0             24.6        >.05
            7 hours                       44.8            44.3            49.5             36.9        >.05
            ≥8 hours                      15.4            16.4            11.0             21.5        >.05
           During the weekends/days off?
            ≤4 hours                      0.5             0.0              1.2             0.0         >.05
            5 hours                       3.8             3.4              1.2             6.3         >.05
            6 hours                       12.7            17.2            15.3             6.3         >.05
            7 hours                       29.7            31.0            32.9             25.0        >.05
            ≥8 hours                      53.3            48.3            49.4             62.5        >.05
           How much sleep do you need (per 24 hours)?
            ≤4 hours                      3.2             3.2              1.1             6.3         >.05
            5 hours                       3.2             4.8              3.3             1.6         >.05
            6 hours                       31.5            43.5            25.6             26.6        >.05
            7 hours                       33.3           24.2*            44.4*            26.6        .03*
            ≥8 hours                      28.8            24.2            25.6             39.1        >0.05
           Bothered by lack of energy because of poor sleep?
           Not at all bothered            45.5            43.5            41.1             52.3        >.05
           Slightly bothered              36.5            40.3            41.1             26.2        >.05
           Moderately bothered            15.3            14.5            15.6             16.9        >.05
           Severely bothered              2.7             1.6              2.2             4.6         >.05
           Past week how rate satisfaction with sleep?
           Excellent                      22.5            17.7            16.7             35.4        >.05
           Good                           46.8            54.8            48.9             33.8        >.05
           Fair                           19.4            16.1            21.1             21.5        >.05
           Poor                           11.3            11.3            13.3             9.2         >.05
                                                                                                      (continues)
          96  |  JSOM   Volume 23, Edition 4 / Winter 2023