
Page 56 - JSOM Fall 2023
P. 56
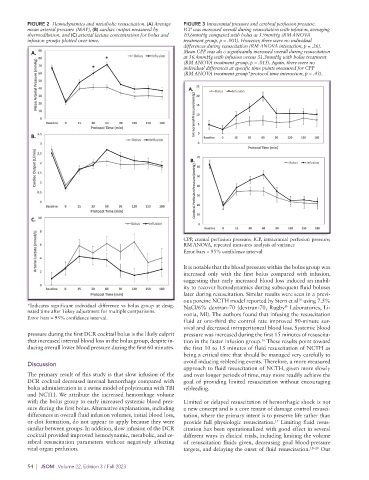
FIGURE 2  Hemodynamics and metabolic resuscitation. (A) Average   FIGURE 3 Intracranial pressure and cerebral perfusion pressure.
          mean arterial pressure (MAP), (B) cardiac output measured by   ICP was increased overall during resuscitation with infusion, averaging
          thermodilution, and (C) arterial lactate concentration for bolus and   10.6mmHg compared with bolus at 5.9mmHg (RM ANOVA
          infusion groups plotted over time.                 treatment group, p < .001). However, there were no individual
                                                             differences during resuscitation (RM ANOVA interaction, p = .26).
                                                             Mean CPP was als o significantly increased overall during resuscitation
                                                             at 36.4mmHg with infusion versus 31.3mmHg with bolus treatment
                                                             (RM ANOVA treatment group, p = .015). Again, there were no
                                                             individual differences at specific time points measured for CPP
                                                             (RM ANOVA treatment group*protocol time interaction, p = .43).


                                                             CPP, cranial perfusion pressure; ICP, intracranial perfusion pressure;
                                                             RM ANOVA, repeated measures analysis of variance
                                                             Error bars = 95% confidence interval

                                                             It is notable that the blood pressure within the bolus group was
                                                             increased only with the  first bolus compared with infusion,
                                                             suggesting that early increased blood loss induced an inabil-
                                                             ity to recover hemodynamics during subsequent fluid boluses
                                                             later during resuscitation. Similar results were seen in a previ-
                                                             ous porcine NCTH model reported by Stern et al  using 7.5%
                                                                                                   16
          *Indicates significant individual difference vs bolus group at desig-  NaCl/6% dextran-70 (dextran-70, Rugby  Laboratories, Li-
                                                                                              ®
          nated time after Tukey adjustment for multiple comparisons.  vonia, MI). The authors found that infusing the resuscitation
          Error bars = 95% confidence interval.
                                                             fluid at one-third the control rate improved 90-minute sur-
                                                             vival and decreased intraperitoneal blood loss. Systemic blood
          pressure during the first DCR cocktail bolus is the likely culprit   pressure was increased during the first 15 minutes of resuscita-
          that increased internal blood loss in the bolus group, despite in-  tion in the faster infusion group.  These results point toward
                                                                                      16
          ducing overall lower blood pressure during the first 60 minutes.  the first 10 to 15 minutes of fluid resuscitation of NCTH as
                                                             being a critical time that should be managed very carefully to
          Discussion                                         avoid inducing rebleeding events. Therefore, a more measured
                                                             approach to fluid resuscitation of NCTH, given more slowly
          The primary result of this study is that slow infusion of the   and over longer periods of time, may more readily achieve the
          DCR cocktail decreased internal hemorrhage compared with   goal of providing limited resuscitation without encouraging
          bolus administration in a swine model of polytrauma with TBI   rebleeding.
          and NCTH. We attribute the increased hemorrhage volume
          with the bolus group to early increased systemic blood pres-  Limited or delayed resuscitation of hemorrhagic shock is not
          sure during the first bolus. Alternative explanations, including   a new concept and is a core tenant of damage control resusci-
          differences in overall fluid infusion volumes, initial blood loss,   tation, where the primary intent is to preserve life rather than
          or clot formation, do not appear to apply because they were   provide full physiologic resuscitation.  Limiting fluid resus-
                                                                                           17
          similar between groups. In addition, slow infusion of the DCR   citation has been operationalized with good effect in several
          cocktail provided improved hemodynamic, metabolic, and ce-  different ways in clinical trials, including limiting the volume
          rebral resuscitation parameters without negatively affecting   of resuscitation fluids given, decreasing goal blood-pressure
          vital organ perfusion.                             targets, and delaying the onset of fluid resuscitation. 18–20  Our

          54  |  JSOM   Volume 22, Edition 3 / Fall 2023