
Page 55 - JSOM Fall 2023
P. 55
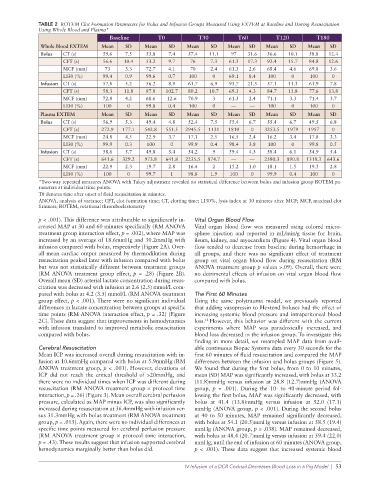
TABLE 2  ROTEM Clot Formation Parameters for Bolus and Infusion Groups Measured Using EXTEM at Baseline and During Resuscitation
              Using Whole Blood and Plasma*
                                     Baseline        T0           T30          T60         T120         T180
              Whole Blood EXTEM   Mean    SD    Mean    SD    Mean    SD   Mean   SD    Mean    SD    Mean   SD
              Bolus   CT (s)       59.6   7.5    53.8   7.4   57.4   11.1    97   31.6  56.6   10.1   58.8  12.4
                      CFT (s)      56.6  10.4    53.2   9.7    76     7.3   61.3  17.3  92.4   15.7   84.8  12.6
                      MCF (mm)     73     3.3    72.7   4.1    70     2.4   61.3  2.6   68.4    4.6   69.8   3.6
                      LI30 (%)     99.4   0.9    99.6   0.7    100    0     69.1  8.4    100    0     100     0
              Infusion  CT (s)     57.8   5.2    56.2   8.9   61.7    6.9   93.7  21.5  57.1   11.3   61.9   7.8
                      CFT (s)      58.3  11.8    87.8  102.7  80.2   10.7   69.3  4.3   84.7   13.8   77.6  13.8
                      MCF (mm)     72.8   4.2    68.6   12.6  70.9    3     61.3  2.4   71.1    3.3   71.4   3.7
                      LI30 (%)     100     0     99.8   0.4    100    0      —     —     100    0     100     0
              Plasma EXTEM        Mean    SD    Mean    SD    Mean    SD   Mean   SD    Mean    SD    Mean   SD
              Bolus   CT (s)       56.9   5.3    49.4   4.8   52.4    7.5   55.4  6.7   55.4    6.7   49.5   6.8
                      CFT (s)     272.9  177.1  542.8  551.5  2945.5  1131  1810   0   3253.5  1979   1957    0
                      MCF (mm)     24.8   4.5    22.9   3.7   17.1    2.5   16.5  2.4   16.2    3.4   17.8   3.3
                      LI30 (%)     99.9   0.3    100     0    99.9    0.4   98.4  3.8    100    0     99.8   0.5
              Infusion  CT (s)     58.6   5.7    49.8   5.4   54.2    9     59.4  4.3   58.4    6.1   54.9   5.4
                      CFT (s)     641.6  329.2  973.8  641.8  2235.5  874.7  —     —   2580.3  890.8  1318.3  643.6
                      MCF (mm)     22.9   2.3    19.7   2.8   16.4    2     15.2  1.0   18.1    1.5   19.3   2.8
                      LI30 (%)     100     0     99.7    1    98.8    1.9   100    0    99.9    0.4   100     0
              *Two-way repeated measures ANOVA with Tukey adjustment revealed no statistical difference between bolus and infusion group ROTEM pa-
              rameters at individual time points.
              T# denotes time after onset of fluid resuscitation in minutes.
              ANOVA, analysis of variance; CFT, clot formation time; CT, clotting time; LI30%, lysis index at 30 minutes after MCF; MCF, maximal clot
              firmness; ROTEM, rotational thromboelastometry
              p < .001). This difference was attributable to significantly in-  Vital Organ Blood Flow
              creased MAP at 30 and 60 minutes specifically (RM ANOVA   Vital organ blood flow was measured  using colored micro-
              treatment group interaction effect, p = .002), where MAP was   sphere injection  and reported  in mL/min/g tissue for brain,
              increased by an average of 18.6mmHg and 30.2mmHg with   ileum, kidney, and myocardium (Figure 4). Vital organ blood
              infusion compared with bolus, respectively (Figure 2A). Over-  flow tended to decrease from baseline during hemorrhage in
              all mean cardiac output measured by thermodilution during   all groups, and there was no significant effect  of treatment
              resuscitation peaked later with infusion compared with bolus   group on vital organ blood flow during resuscitation (RM
              but was not statistically different between treatment groups   ANOVA treatment group p values >.09). Overall, there were
              (RM ANOVA treatment group effect,  p  = .28) (Figure 2B).   no detrimental effects of infusion on vital organ blood flow
              Overall mean (SD) arterial lactate concentration during resus-  compared with bolus.
              citation was decreased with infusion at 2.6 (2.5) mmol/L com-
              pared with bolus at 4.2 (3.5) mmol/L (RM ANOVA treatment   The First 60 Minutes
              group effect, p < .001). There were no significant individual   Using the same polytrauma model, we previously reported
              differences in lactate concentration between groups at specific   that adding vasopressin to Hextend boluses had the effect of
              time points (RM ANOVA interaction effect, p = .32) (Figure   increasing systemic blood pressure and intraperitoneal blood
              2C). These data suggest that improvements in hemodynamics   loss. However, this behavior was different with the current
                                                                    12
              with infusion translated to improved metabolic resuscitation   experiments where MAP was paradoxically increased, and
              compared with bolus.                               blood loss decreased in the infusion group. To investigate this
                                                                 finding in more detail, we resampled MAP data from avail-
              Cerebral Resuscitation                             able continuous Biopac Systems data every 30 seconds for the
              Mean ICP was increased overall during resuscitation with in-  first 60 minutes of fluid resuscitation and compared the MAP
              fusion at 10.6mmHg compared with bolus at 5.9mmHg (RM   differences between the infusion and bolus groups (Figure 5).
              ANOVA treatment group, p < .001). However, elevations of   We found that during the first bolus, from 0 to 10 minutes,
              ICP did not reach the critical threshold of >20mmHg, and   mean (SD) MAP was significantly increased, with bolus at 33.2
              there were no individual times when ICP was different during   (11.8)mmHg  versus  infusion  at  28.8  (12.7)mmHg  (ANOVA
              resuscitation (RM ANOVA treatment group × protocol time   group,  p = .001). During the 10- to 40-minute period fol-
              interaction, p = .26) (Figure 3). Mean overall cerebral perfusion   lowing the first bolus, MAP was significantly decreased, with
              pressure, calculated as MAP minus ICP, was also significantly   bolus at 41.4 (13.8)mmHg versus  infusion at 52.0 (17.1)
              increased during resuscitation at 36.4mmHg with infusion ver-  mmHg (ANOVA group, p < .001). During the second bolus
              sus 31.3mmHg with bolus treatment (RM ANOVA treatment   at 40 to 50 minutes, MAP remained significantly decreased,
              group, p = .015). Again, there were no individual differences at   with bolus at 54.1 (20.5)mmHg versus infusion at 58.5 (19.4)
              specific time points measured for cerebral perfusion pressure   mmHg (ANOVA group, p = .038). MAP remained decreased,
              (RM  ANOVA treatment group  × protocol time interaction,    with bolus at 48.4 (20.7)mmHg versus infusion at 59.4 (22.0)
              p = .43). These results suggest that infusion supported cerebral   mmHg, until the end of infusion at 60 minutes (ANOVA group,
              hemodynamics marginally better than bolus did.     p < .001). These data suggest that increased systemic blood

                                                             IV Infusion of a DCR Cocktail Decreases Blood Loss in a Pig Model  |  53