
Page 54 - JSOM Fall 2023
P. 54
of DCR cocktail infused at a constant 0.33mL/kg/min rate to pigs in each group were required to achieve 80% power to
achieve an equivalent total volume of 20mL/kg over 1 hour. detect differences with alpha = 0.05
No other fluid resuscitation was given, and pigs were moni- Results
tored for up to 3 hours after the start of fluid resuscitation or
until the time of spontaneous death, defined as a loss of pulsa- There were no baseline differences in weight, TBI percussion,
tile arterial blood pressure waveform and MAP <20mmHg for catheter hemorrhage volume, and lactate at the start of resus-
at least 1 minute. Animals were euthanized under anesthesia citation between bolus and infusion groups (Table 1). All ani-
with an overdose of pentobarbital (100mg/kg) (Med-Pharmex, mals in all groups received a total of 20mL/kg of DCR cocktail.
Pomona, CA).
Blood Loss, Survival, and Coagulation
Outcome Measurements Internal hemorrhage volume was significantly decreased by
Primary outcome measurements were intraperitoneal blood 42% with infusion versus bolus (t-test, p = .038) (Table 1.)
loss measured at the time of death or at 3 hours using pre- Median (IQR) intraperitoneal bleeding rate adjusted for sur-
weighed laparotomy sponges, reported in mL/kg and as the vival time was 0.26 (0.06, 0.56) mL/kg/min with bolus and
bleeding rate adjusted for survival time in mL/kg/min, and 0.058 (0.03, 0.22) with infusion (Wilcoxon p = .09). Internal
time-to-event survival to 3 hours. Secondary outcomes in- hemorrhage volume was also significantly and negatively cor-
cluded hemodynamics, metabolic markers of resuscitation related with survival time (r = –0.85; p < .001). Survival to 3
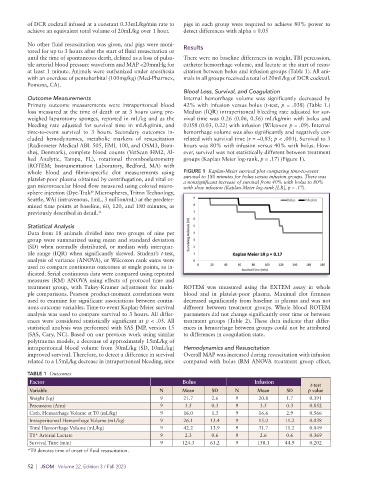
(Radiometer Medical ABL 505, EML 100, and OSM3, Brøn- hours was 80% with infusion versus 40% with bolus. How-
shøj, Denmark), complete blood counts (VetScan HM2, Al- ever, survival was not statistically different between treatment
lied Analytic, Tampa, FL), rotational thromboelastometry groups (Kaplan Meier log-rank, p = .17) (Figure 1).
(ROTEM; Instrumentation Laboratory, Bedford, MA) with
whole blood and fibrin-specific clot measurements using FIGURE 1 Kaplan-Meier survival plot comparing time-to-event
platelet-poor plasma obtained by centrifugation, and vital or- survival to 180 minutes for bolus versus infusion groups. There was
a nonsignificant increase of survival from 40% with bolus to 80%
gan microvascular blood flow measured using colored micro- with slow infusion (Kaplan-Meier log-rank [LR], p = .17).
sphere injection (Dye-Trak Microspheres, Triton Technology,
®
Seattle, WA) (intravenous, 1mL, 3 million/mL) at the predeter-
mined time points at baseline, 60, 120, and 180 minutes, as
previously described in detail. 11
Statistical Analysis
Data from 18 animals divided into two groups of nine per
group were summarized using mean and standard deviation
(SD) when normally distributed, or median with interquar-
tile range (IQR) when significantly skewed. Student’s t-test,
analysis of variance (ANOVA), or Wilcoxon rank sums were
used to compare continuous outcomes at single points, as in-
dicated. Serial continuous data were compared using repeated
measures (RM) ANOVA using effects of protocol time and
treatment group, with Tukey-Kramer adjustment for multi- ROTEM was measured using the EXTEM assay in whole
ple comparisons. Pearson product-moment correlations were blood and in platelet-poor plasma. Maximal clot firmness
used to examine for significant associations between contin- decreased significantly from baseline in plasma and was not
uous outcome variables. Time-to-event Kaplan-Meier survival different between treatment groups. Whole blood ROTEM
analysis was used to compare survival to 3 hours. All differ- parameters did not change significantly over time or between
ences were considered statistically significant at p < .05. All treatment groups (Table 2). These data indicate that differ-
statistical analysis was performed with SAS JMP, version 15 ences in hemorrhage between groups could not be attributed
(SAS, Cary, NC). Based on our previous work using similar to differences in coagulation state.
polytrauma models, a decrease of approximately 15mL/kg of
intraperitoneal blood volume from 30mL/kg (SD, 10mL/kg) Hemodynamics and Resuscitation
improved survival. Therefore, to detect a difference in survival Overall MAP was increased during resuscitation with infusion
related to a 15mL/kg decrease in intraperitoneal bleeding, nine compared with bolus (RM ANOVA treatment group effect,
TABLE 1 Outcomes
Factor Bolus Infusion
t-test
Variable N Mean SD N Mean SD p value
Weight (kg) 9 21.7 2.6 9 20.8 1.7 0.391
Percussion (Atm) 9 3.5 0.3 9 3.5 0.3 0.852
Cath. Hemorrhage Volume at T0 (mL/kg) 9 16.0 1.3 9 16.6 2.9 0.566
Intraperitoneal Hemorrhage Volume (mL/kg) 9 26.1 13.4 9 15.0 11.2 0.038
Total Hemorrhage Volume (mL/kg) 9 42.2 13.9 9 31.7 11.2 0.049
T0* Arterial Lactate 9 2.3 0.6 9 2.6 0.6 0.369
Survival Time (min) 9 124.3 61.2 9 158.1 44.9 0.202
*T0 denotes time of onset of fluid resuscitation.
52 | JSOM Volume 22, Edition 3 / Fall 2023