
Page 96 - 2022 Spring JSOM
P. 96
should be very close to the median value, which is the value issues). A linear regression may now be calculated using Mic-
that is both greater than and less than 50% of the other values. rosoft Excel by going to the Data tab, then under the Analysis
As can be seen by the median and mean values of the data in section, selecting Data Analysis. This will prompt a window
Table 2, the means and medians are quite different, with the where one can select Linear Regression as well as designate the
means being much larger than the medians. This situation can pertinent ranges for the independent and dependent variables
be corrected through transformation of the data by taking the based on the reference spreadsheet.
natural logarithm of each value. This works for all the values
except zero, which has a natural log of negative infinity (and
is, therefore, undefined). In this case, we replaced these val- Results
ues with a value of zero, which was the same as the natural Using a 95% confidence interval, this model showed an ad-
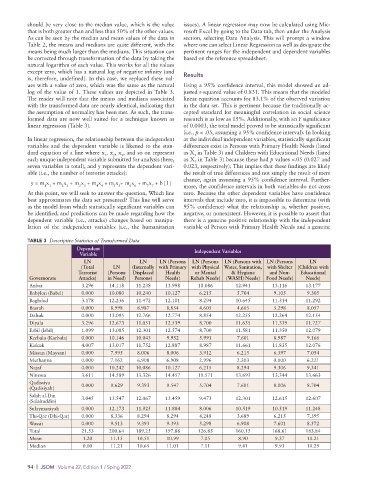
log of the value of 1. These values are depicted in Table 3. justed r-squared value of 0.831. This means that the modeled
The reader will note that the means and medians associated linear equation accounts for 83.1% of the observed variation
with the transformed data are nearly identical, indicating that in the data set. This is pertinent because the traditionally ac-
the assumption of normality has been met. As such, the trans- cepted standard for meaningful correlation in social science
formed data are now well suited for a technique known as research is as low as 15%. Additionally, with an F significance
linear regression (Table 3). of 0.0003, the total model proved to be statistically significant
(i.e., p < .05, assuming a 95% confidence interval). In looking
In linear regression, the relationship between the independent at the individual independent variables, statistically significant
variables and the dependent variable is likened to the stan- differences exist in Persons with Primary Health Needs (listed
dard equation of a line where x , x , x , and so on represent as X in Table 3) and Children with Educational Needs (listed
3
1
2
3
each unique independent variable submitted for analysis (here, as X in Table 3) because these had p values <.05 (0.027 and
7
seven variables in total), and y represents the dependent vari- 0.023, respectively). This implies that these findings are likely
able (i.e., the number of terrorist attacks): the result of true differences and not simply the result of mere
chance, again assuming a 95% confidence interval. Further-
y = m x + m x + m x + m x + m x + m x + m x + b [1]
1 1 2 2 3 3 4 4 5 5 6 6 7 7 more, the confidence intervals in both variables do not cross
At this point, we will seek to answer the question, Which line zero. Because the other dependent variables have confidence
best approximates the data set presented? This line will serve intervals that include zero, it is impossible to determine (with
as the model from which statistically significant variables can 95% confidence) what the relationship is, whether positive,
be identified, and predictions can be made regarding how the negative, or nonexistent. However, it is possible to assert that
dependent variable (i.e., attacks) changes based on manipu- there is a genuine positive relationship with the independent
lation of the independent variables (i.e., the humanitarian variable of Person with Primary Health Needs and a genuine
TABLE 3 Descriptive Statistics of Transformed Data
Dependent
Variable Independent Variables
LN LN LN (Persons LN (Persons LN (Persons with LN (Persons LN
(Total LN (Internally with Primary with Physical Water, Sanitation, with Shelter (Children with
Terrorist (Persons Displaced Health or Mental & Hygiene and Non- Educational
Governorate Attacks) in Need) Persons) Needs) Rehab Needs) (WASH) Needs) Food Needs) Needs)
Anbar 3.296 14.118 11.238 13.998 10.086 12.941 13.116 13.177
Babylon (Babel) 0.000 10.080 10.240 10.127 6.215 5.704 9.105 9.305
Baghdad 3.178 12.236 11.472 12.101 8.294 10.645 11.314 11.292
Basrah 0.000 8.998 8.987 8.854 4.605 4.605 5.298 8.057
Dahuk 0.000 13.095 12.766 12.774 8.854 12.255 12.264 12.154
Diyala 3.296 12.673 11.051 12.539 8.700 11.635 11.339 11.727
Erbil (Irbil) 1.099 13.085 12.301 12.574 8.700 11.581 11.350 12.079
Kerbala (Karbala) 0.000 10.146 10.043 9.952 5.991 7.601 8.987 9.166
Kirkuk 4.007 13.017 11.752 12.887 8.987 11.661 11.835 12.076
Missan (Maysan) 0.000 7.995 8.006 8.006 3.912 6.215 6.397 7.054
Muthanna 0.000 7.162 6.908 6.908 2.996 2.303 0.000 6.221
Najaf 0.000 10.242 10.086 10.127 6.215 8.294 9.306 9.341
Ninewa 3.611 14.589 13.326 14.457 10.571 13.693 13.344 13.663
Qadissiya
(Qadisiyah) 0.000 9.629 9.393 9.547 5.704 7.601 8.006 8.704
Salah al-Din
(Salahuddin) 3.045 13.547 12.067 13.459 9.473 12.301 12.615 12.607
Sulaymaniyah 0.000 12.173 11.925 11.884 8.006 10.519 10.519 11.248
Thi-Qar (Dhi-Qar) 0.000 8.336 8.294 8.294 4.248 3.689 6.215 7.395
Wassit 0.000 9.513 9.393 9.393 5.298 6.908 7.601 8.572
Total 21.53 200.64 189.25 197.88 126.85 160.15 168.61 183.84
Mean 1.20 11.15 10.51 10.99 7.05 8.90 9.37 10.21
Median 0.00 11.21 10.65 11.01 7.11 9.41 9.91 10.29
94 | JSOM Volume 22, Edition 1 / Sping 2022