
Page 97 - 2022 Spring JSOM
P. 97
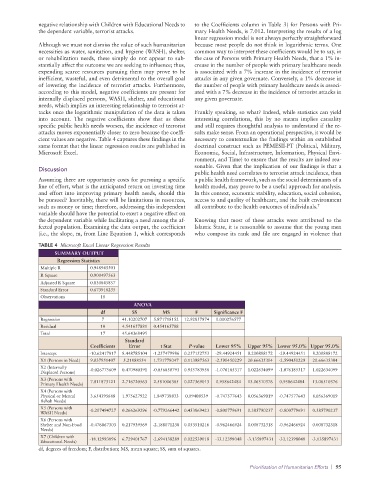
negative relationship with Children with Educational Needs to   to the Coefficients column in Table 3) for Persons with Pri-
              the dependent variable, terrorist attacks.         mary Health Needs, is 7.012. Interpreting the results of a log
                                                                 linear regression model is not always perfectly straightforward
              Although we must not dismiss the value of such humanitarian   because most people do not think in logarithmic terms. One
              necessities as water, sanitation, and hygiene (WASH), shelter,   common way to interpret these coefficients would be to say, in
              or rehabilitation needs, these simply do not appear to sub-  the case of Persons with Primary Health Needs, that a 1% in-
              stantially affect the outcome we are seeking to influence; thus,   crease in the number of people with primary healthcare needs
              expending  scarce  resources  pursuing  them  may  prove  to  be   is associated with a 7% increase in the incidence of terrorist
              inefficient, wasteful, and even detrimental to the overall goal   attacks in any given governate. Conversely, a 1% decrease in
              of lowering the incidence of terrorist attacks. Furthermore,   the number of people with primary healthcare needs is associ-
              according to this model, negative coefficients are present for   ated with a 7% decrease in the incidence of terrorist attacks in
              internally displaced persons, WASH, shelter, and educational   any given governate.
              needs, which implies an interesting relationship to terrorist at-
              tacks once the logarithmic manipulation of the data is taken   Frankly speaking, so what? Indeed, while statistics can yield
              into account. The negative coefficients show that as these   interesting correlations, this by no means implies causality
              specific public health needs worsen, the incidence of terrorist   and still requires thoughtful analysis to understand if the re-
              attacks moves exponentially closer to zero because the coeffi-  sults make sense. From an operational perspective, it would be
              cient values are negative. Table 4 captures these findings in the   necessary to contextualize the findings within an established
              same format that the linear regression results are published in   doctrinal construct such as PEMESII-PT (Political, Military,
              Microsoft Excel.                                   Economic, Social, Infrastructure, Information, Physical Envi-
                                                                 ronment, and Time) to ensure that the results are indeed rea-
                                                                 sonable. Given that the implication of our findings is that a
              Discussion
                                                                 public health need correlates to terrorist attack incidence, then
              Assuming there are opportunity costs for pursuing a specific   a public health framework, such as the social determinants of a
              line of effort, what is the anticipated return on investing time   health model, may prove to be a useful approach for analysis.
              and effort into improving primary health needs, should this   In this context, economic stability, education, social cohesion,
              be pursued? Inevitably, there will be limitations in resources,   access to and quality of healthcare, and the built environment
              such as money or time; therefore, addressing this independent   all contribute to the health outcomes of individuals. 7
              variable should have the potential to exert a negative effect on
              the dependent variable while facilitating a need among the af-  Knowing that most of these attacks were attributed to the
              fected population. Examining the data output, the coefficient   Islamic State, it is reasonable to assume that the young men
              (i.e., the slope, m, from Line Equation 1, which corresponds   who compose its rank and file are engaged in violence that
              TABLE 4  Microsoft Excel Linear Regression Results
                   SUMMARY OUTPUT
                    Regression Statistics
              Multiple R       0.948945501
              R Square         0.900497563
              Adjusted R Square  0.830845857
              Standard Error   0.673918235
              Observations        18
                                             ANOVA
                                  df        SS        MS         F     Significance F
              Regression          7      41.10202707  5.871718152  12.92857874  0.000276577
              Residual            10     4.541657881  0.454165788
              Total               17     45.64368495
                                          Standard
                               Coefficients  Error   t Stat    P-value  Lower 95%  Upper 95% Lower 95.0% Upper 95.0%
              Intercept       -10.62417817  8.448785104  -1.257479986  0.237152753  -29.44924451  8.200888172  -29.44924451  8.200888172
              X1 (Persons in Need)  9.037951407  5.21888554  1.731778047  0.113987563  -2.590450229  20.66635304  -2.590450229  20.66635304
              X2 (Internally   -0.026775609  0.470980391  -0.056850793  0.955783958  -1.076185317  1.022634099  -1.076185317  1.022634099
              Displaced Persons)
              X3 (Persons with   7.011873121  2.716720563  2.581006385  0.027369013  0.958642484  13.06510376  0.958642484  13.06510376
              Primary Health Needs)
              X4 (Persons with
              Physical or Mental   3.654395688  1.975627922  1.849738833  0.09408539  -0.747577643  8.056369019  -0.747577643  8.056369019
              Rehab Needs)
              X5 (Persons with   -0.207494727  0.266269296  -0.779266442  0.453869423  -0.800779691  0.385790237  -0.800779691  0.385790237
              WASH Needs)
              X6 (Persons with
              Shelter and Non-Food   -0.476867303  0.217939569  -2.188071238  0.053510216  -0.962466924  0.008732318  -0.962466924  0.008732318
              Needs)
              X7 (Children with
              Educational Needs)  -18.12993896  6.729401767  -2.694138289  0.022539018  -33.12398048  -3.135897431  -33.12398048  -3.135897431
              df, degrees of freedom; F, distribution; MS, mean square; SS, sum of squares.


                                                                                   Prioritization of Humanitarian Efforts  |  95