
Page 61 - JSOM Spring 2020
P. 61
standards were analyzed in duplicate. Linear regression was Gas Chromatography–Mass Spectrometry (GC-MS)
applied to obtain the calibration model. For ammonia, a sec- We analyzed ethylene dibromide on a model 7890 B gas chro-
ond-order polynomial was applied to obtain a more optimal matograph and a model 5977A MSD mass spectrometer (Ag-
fit compared with linear regression. In the case of fentanyl, ilent). We used a VF-5MS (30m ✕ 250µm × 0.25µm, Agilent)
we used weighted regression (1/Y ) to improve the fit of the column with helium at 1mL/min as carrier gas. The injection
2
model at low concentration (see supplementary data at https:// volume was 1.0µL using a split-less injector at 250°C. The
jsom.us/deKoningSupp. solvent was n-hexane. The temperature program was 40°C for
2 minutes followed by an increase of 10°C/min to a final tem-
For each analyte, we prepared independent QC samples at two perature of 280°C at 26 minutes. Ionization of the compounds
concentrations and analyzed these in triplicate to assess the was accomplished by electron impact (EI; 70 V, 230°C). Detec-
accuracy and precision of the method. The two concentrations tion of ethylene dibromide was done by scanning the MS from
of the QC samples were selected around the desired LOQ of m/z 25 to 600 and using the m/z 107 ion for quantification.
100ng/mL (Table 2). The lower LOQ was defined as the low-
est concentration in the calibration curve still yielding an ac- Liquid Chromatography–Mass Spectrometry (LC-MS)
curacy within 20% of the true concentration. We assessed the We analyzed methylamine, hydrazine, phenylhydrazine, fen-
performance of each method by calculation of the precision tanyl, and capsaicin by using LC-MS/MS on a model Xevo
(the standard deviation expressed as a percentage) and the TQ-S (Waters) equipped with Acquity M-class UPLC sys-
accuracy (100 * measured concentration/true concentration). tem (Waters) and electrospray ionization. The column used
For the acceptance of the methods, we required the precision was an Acquity HSS T3, 2.1 ✕ 100mm, 1.8µm (Waters No.
to be within 15% and the accuracy in the range of 85% to 186003539). The mobile phases were water (A) and acetoni-
115%, in line with FDA guidelines for analytical methods. 21 trile (B), both containing 0.2% formic acid. We used a gra-
dient from 0% B to 80% B in 10 minutes at a flow rate of
100µL/min. The injection volume was 1µL. The mass spec-
Analytical Methods
trometer was operated in MS/MS mode with Argon as col-
Ion Chromatography (IC) lision gas.
For the analyses of sulfate, fluoride, and ammonia, we used IC
on a Dionex ICS 2100 system (ThermoFisher) and a model Di- We analyzed methylamine and hydrazine as AccQTag deriv-
onex AERS 500 suppressor (4mm ThermoFisher No. 082540) atives to increase their mass and to increase retention on a
for sulfate and fluoride and a Dionex CERS 500e suppres- C18 column. A solution of the AccQTag reagent was prepared
sor (4mm, ThermoFisher SP6954/No. 302663) for ammonia. according to the instruction manual.
For the anions we used a Dionex IonPac AS14A RFIC column
(4 ✕ 250mm, ThermoFisher No. 056904) and the eluent con- Results and Discussion
sisted of 8.0mmol/L sodium carbonate and 1.0mmol/L sodium
bicarbonate in water. Ammonia was analyzed using a Dionex Development of Analytical Methods
IonPac CS12A RFIC column (4 ✕ 250mm, ThermoFisher No. We used several analytical techniques to develop quantitative
046073) and 20mmol/L methanesulfonic acid as eluent. The methods. In most cases, LC-MS proved useful, either by di-
flow rate was 1mL/min for all IC methods. rect analysis of the agent or after derivatization of the agent
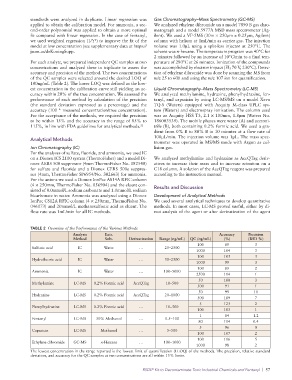
TABLE 2 Overview of the Performance of the Various Methods
Analysis Extr. Accuracy Precision
Method Solv. Derivatization Range (ng/mL) QC (ng/mL) (%) (RSD %)
100 89 3
Sulfuric acid IC Water … 25–2500
1000 104 3
100 103 3
Hydrofluoric acid IC Water … 50–2500
1000 99 3
100 89 2
Ammonia IC Water … 100–5000
2500 114 1
50 100 3
Methylamine LC-MS 0.2% Formic acid AccQTag 10–500
500 91 1
50 99 11
Hydrazine LC-MS 0.2% Formic acid AccQTag 20–1000
500 109 7
5 123 2
Phenylhydrazine LC-MS 0.2% Formic acid … 10–500
100 103 1
1 84 1.2
Fentanyl LC-MS 50% Methanol … 0.5–100
80 114 0.4
5 96 0
Capsaicin LC-MS Methanol … 5–500
100 107 2
100 116 5
Ethylene dibromide GC-MS n-Hexane … 100–1000
1000 98 2
The lowest concentration in the range reported is the lowest limit of quantification (LLOQ) of the methods. The precision, relative standard
deviation, and accuracy for the QC samples at two concentrations are all within 15% limits.
RSDL Kit to Decontaminate Toxic Industrial Chemicals and Fentanyl | 57
®