
Page 54 - JSOM Spring 2020
P. 54
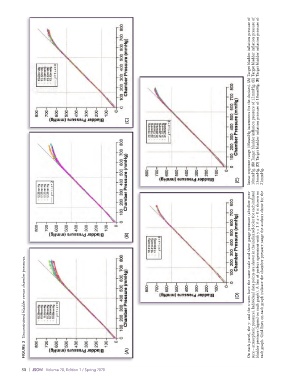
(C)                                               linear response range (50mmHg increments for the choices). (A) Target bladder inflation pressure of  10mmHg. (B) Target bladder inflation pressure of 12mmHg. (C) Target bladder inflation pressure of  15mmHg. (D) Target bladder inflation pressure of 18mmHg. (E) Target bladder inflation pressure of


                                                                                                              21mmHg.

                                                                                                    (E)


                                                      (B)


           FIGURE 3  Unconstrained bladder versus chamber pressures.


                                                                                                    (D) On each panel, the y- and the x-axes have the same scale and show gauge pressure (absolute pres-  sure – atmospheric pressure). Individual data points are shown in the indicated color for each inflated  bladder pressure (legend on each graph). A line of perfect agreement with y = 1 ✕ x + 0 is shown on  each graph. Grid lines on each graph indicate the chamber pressure range


                                                      (A)


          50  |  JSOM   Volume 20, Edition 1 / Spring 2020