
Page 52 - JSOM Spring 2020
P. 52
®
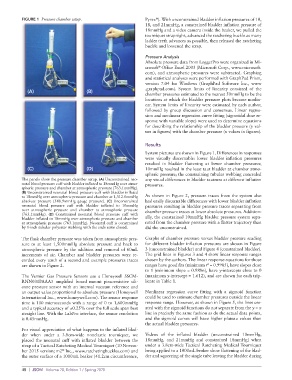
FIGURE 1 Pressure chamber setup. Pyrex ). With unconstrained bladder inflation pressures of 10,
18, and 21mmHg, a constrained bladder inflation pressure of
18mmHg and a video camera inside the beaker, we pulled the
tourniquet strap tight, advanced the ratcheting buckle as many
ladder teeth advances as possible, then released the ratcheting
buckle and loosened the strap.
Pressure Analysis
Absolute pressure data from LoggerPro were organized in Mi-
crosoft Office Excel 2003 (Microsoft Corp., www.microsoft.
®
com), and atmospheric pressures were subtracted. Graphing
and statistical analyses were performed with GraphPad Prism,
version 7.04 for Windows (GraphPad Software Inc., www
.graphpad.com). System limits of linearity consisted of the
(A) (B)
chamber pressures estimated to the nearest 50mmHg to be the
locations at which the bladder pressure plots became nonlin-
ear. System limits of linearity were estimated by each author,
followed by group discussion and consensus. Linear regres-
sion and nonlinear regression curve fitting (sigmoidal dose re-
sponse with variable slope) were used to determine equations
for describing the relationship of the bladder pressure (y val-
ues in figures) with the chamber pressure (x values in figures).
Results
System pictures are shown in Figure 1. Differences in responses
were visually discernable: lower bladder inflation pressures
resulted in bladder flattening at lower chamber pressures;
(C) (D) 10mmHg resulted in the least taut bladder at chamber atmo-
spheric pressure; the constraining tubular webbing concealed
The panels show the pressure chamber setup. (A) Unconstrained neo- any visual differences in bladder tautness at different inflation
natal blood pressure cuff with bladder inflated to 18mmHg over atmo- pressures.
spheric pressure and chamber at atmospheric pressure (763.1mmHg).
(B) Unconstrained neonatal blood pressure cuff with bladder inflated
to 18mmHg over atmospheric pressure and chamber at 1,312.0mmHg As shown in Figure 2, pressure traces from the system also
absolute pressure (548.9mmHg gauge pressure). (C) Unconstrained had easily discernable differences with lower bladder inflation
neonatal blood pressure cuff with bladder inflated to 10mmHg pressures resulting in bladder pressure traces separating from
over atmospheric pressure and chamber at atmospheric pressure chamber pressure traces at lower absolute pressures. Addition-
(763.1mmHg). (D) Constrained neonatal blood pressure cuff with
bladder inflated to 18mmHg over atmospheric pressure and chamber ally, the constrained 10mmHg bladder pressure system sepa-
at atmospheric pressure (763.1mmHg). Neonatal cuff is constrained rated from the chamber pressure with a flatter trajectory than
by 1-inch tubular polyester webbing with the ends sewn closed. did the unconstrained.
The flask chamber pressure was taken from atmospheric pres- Graphs of chamber pressure versus bladder pressure reading
sure to at least 1,500mmHg absolute pressure and back to for different bladder inflation pressures are shown in Figure
atmospheric pressure by the addition and removal of 60mL 3 (unconstrained bladder) and Figure 4 (constrained bladder).
increments of air. Chamber and bladder pressures were re- The grid lines in Figures 3 and 4 show linear response ranges
corded every tenth of a second and example pressures traces chosen by the authors. The linear response equations for those
are shown in Figure 2. ranges have good fits (minimum r = 0.9985), have slopes close
2
to 1 (minimum slope = 0.9886), have y-intercepts close to 0
The Vernier Gas Pressure Sensors use a Honeywell SSCM- (maximum y-intercept = 1.612), and are shown for each trip-
RNN030PAAA5 amplified board mount piezoresistive sili- licate in Table 1.
cone pressure sensor with an internal vacuum reference and
an output value proportional to absolute pressure (Honeywell Nonlinear regression curve fitting with a sigmoid function
International Inc., www.honeywell.com). The sensor response could be used to estimate chamber pressures outside the linear
time is 100 microseconds with a range of 0 to 1,600mmHg response range. However, as shown in Figure 5, the lines cre-
and a typical accuracy of ±0.25% over the full scale span best ated with the sigmoid functions do not separate from the y = x
straight line. With the LabPro interface, the sensor resolution line in precisely the same fashion as do the actual data points,
is 0.45mmHg. and the sigmoid curves will have higher plateau values than
the actual bladder pressures.
For visual appreciation of what happens to the inflated blad-
der when under a 3.8cm-wide nonelastic tourniquet, we Videos of the inflated bladder (unconstrained 10mmHg,
placed the neonatal cuff with inflated bladder between the 18mmHg, and 21mmHg and constrained 18mmHg) when
strap of a Tactical Ratcheting Medical Tourniquet (10 Novem- under a 3.8cm-wide Tactical Ratcheting Medical Tourniquet
ber 2015 version; m2 Inc., www.ratchetingbuckles.com) and being applied to a 1000mL beaker show flattening of the blad-
®
the outer surface of a 1000mL beaker (41.2cm circumference, der and squeezing of the single tube leaving the bladder during
48 | JSOM Volume 20, Edition 1 / Spring 2020