
Page 141 - JSOM Spring 2020
P. 141
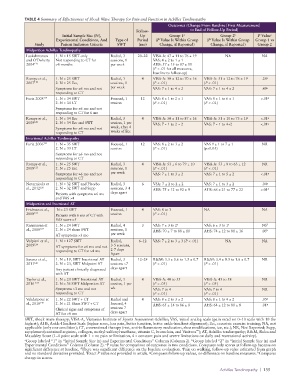
TABLE 4 Summary of Effectiveness of Shock Wave Therapy for Pain and Function in Achilles Tendinopathy
                                                                       Outcomes (Change From Baseline [First Measurement]
                                                         Follow-                to End of Follow-Up Period)
                           Initial Sample Size (N),        Up          Group 1              Group 2 b       P Value c
                                                                             a
                        Experimental Conditions, And   Type of   Period   (P Value Is Within Group   (P Value Is Within Group   Group 1 vs
               Study      Patient Inclusion Criteria  SWT  (mo)    Change, if Reported)  Change, if Reported)  Group 2
            Midportion Achilles Tendinopathy
            Laskshmanan   1. N = 15 SWT only   Radial, 3   20–22  VISA-A: 47 ± 11 to 76 ± 19  NA             NA
            and O’Doherty   Not responding to CT for    sessions, 1   VAS: 4 ± 2 to 1 ± 1
            2004 117    >6 months              per week         AHS: 57 ± 15 to 87 ± 11
                                                                (P < .01 for all measures,
                                                                baseline to follow-up)
            Rompe et al.,   1. N = 25 SWT      Radial, 3    4   VISA-A: 50 ± 12 to 70 ± 16  VISA-A: 51 ± 12 to 76 ± 19  .26 g
            2007 118    2. N = 25 Ecc,         sessions, 1      (P < .01)            (P < .01)
                        Symptoms for ≥6 mo and not   per week   VAS: 7 ± 1 to 4 ± 2  VAS: 7 ± 1 to 4 ± 2     .49 g
                        responding to CT
            Furia 2008 119  1. N = 34 SWT      Focused, 1   12  VAS: 8 ± 1 to 2 ± 1  VAS: 8 ± 1 to 6 ± 1     <.01 g
                        2. N = 34 CT           session          (P < .01)            (P < .01)
                        Symptoms for ≥6 mo and not
                        responding to CT for 6 mo
            Rompe et al.,   1. N = 34 Ecc      Radial, 3    4   VISA-A: 50 ± 11 to 87 ± 16  VISA-A: 51 ± 10 to 73 ± 19  <.01 g
            2009 120    2. N = 34 Ecc and SWT  session, 1 per   VAS: 7 ± 1 to 2 ± 2  VAS: 7 ± 1 to 4+2       <.01 g
                        Symptoms for ≥6 mo and not   week, after 4
                        responding to CT       weeks of Ecc
            Insertional Achilles Tendinopathy
            Furia 2006 121  1. N = 35 SWT      Focused, 1   12  VAS: 8 ± 2 to 3 ± 2  VAS 9 ± 1 to 7 ± 1      NR
                        2. N = 33 CT           session          (P < .01)            (p>0.05)
                        Symptoms for ≥6 mo and not
                        responding to CT
            Rompe et al.,   1. N = 25 SWT      Radial, 3    4   VISA-A: 53 ± 6 to 79 ± 10  VISA-A: 53 ± 8 to 63 ± 12  NR
            2008 122    2. N = 25 Ecc          sessions, 1      (P < .01)            (P < .01)
                        Symptoms for ≥6 mo and not   per week   VAS: 7 ± 1 to 3 ± 2  VAS: 7 ± 1 to 5 ± 2     <.01 g
                        responding to CT
            Notarnicola et   1. N = 32 SWT and Placebo  Radial, 3   6  VSA: 7 ± 2 to 2 ± 2  VAS: 7 ± 1 to 3 ± 2  .04 g
            al., 2012 126  2. N = 32 SWT and Supp  sessions, 3-4   AHS: 75 ± 12 to 92 ± 9  AHS: 66 ± 21 to 77 ± 22  <.01 d
                        Patients with symptoms ≥6 mo   days apart
                        and VAS >4
            Midportion and Insertional AT
            Fridman et al.,    N = 23 SWT      Focused, 1   4   VAS: 8 to 3          NA                      NA
            2008 123    Patients with 6 mo of CT with   session  (P < .01)
                        VAS score >5
            Rasmussen et   1. N = 24 SWT       Radial, 4    3   VAS: 7 ± 3 to 2 e    VAS: 6 ± 3 to 1 e       NS f
            al., 2008 127  2. N = 24 sham SWT  sessions, 1      AHS: 70 ± 7 to 88 ± 10  AHS: 74 ± 12 to 81 ± 16  .05 h
                        AT symptoms >3 mo      per week
            Vulpiani et al.,   1. N = 127 SWT  Radial,    6–12  VAS: 7 ± 2 to 3 ± 3 (P < .01)  NA            NA
            2009 124    AT symptoms for ≥6 mo and not   3-5 sessions,
                        responding to CT for >4 mo  2-7 days
                                               Apart
            Saxena et al.,   1. N = 19, SWT Insertional AT  Radial, 3   12–24  R&M: 3.3 ± 0.6 to 1.5 ± 0.7  R&M: 3.4 ± 0.5 to 1.6 ± 0.7  NR
            2011 128    2. N = 23, SWT Midpoint AT  sessions ~7   (P < .01)          (P < .01)
                        Any patient clinically diagnosed   days apart
                        with AT
            Taylor et al.,   1. N = 20 SWT Insertional AT  Radial, 3   4  VISA-A: 40 to 55  VISA-A: 43 to 58  NR
            2016  125   2. N = 36 SWT Midportion AT  session, 1 per   (P < .05)      (P < .05)
                        Symptoms >3 mo and not   wk             VAS: 7 to 4          VAS: 7 to 4             NR
                        responding to CT                        (P < .01)            (P < .01)
            Vahdatpour et   1. N = 22 SWT + CT  Radial and   4  VAS: 8 ± 2 to 3 ± 2  VAS: 8 ± 1 to 4 ± 2     .05 g
            al., 2018 149  2. N = 21 Sham SWT + CT  focused, 4   AHS: 65 ± 14 to 86 ± 8  AHS: 64 ± 12 to 80 ± 8  .01 g
                        Clinical signs and symptoms of   sessions 7
                        AT for >6 mo           days apart
           SWT, shock wave therapy; VISA-A, Victorian Institute of Sports Assessment-Achilles; VAS, visual analog scale (pain rated on 0–10 scale with 10 the
           highest); AHS, Ankle-Hindfoot Scale (higher score, less pain, better function, better ankle-hindfoot alignment); Ecc, eccentric exercise training; NA, not
           applicable (only one condition); CT, conventional therapy (rest, anti-inflammatory medication, shoe modifications, ice, etc.); NR, Not Reported; Supp,
           supplement(contained arginine, collagen, methyl-sulfonyl-methane, vitamin C, bromelain, and Vinitrox ); AT, Achilles tendinopathy; R&M, Roles and
                                                                                  ™
           Maudsley Score (1–4 point scale with 1 = no pain or limitation, 4 = constant pain and severe limitations on daily and recreational activity).
           a Group labeled “1” in “Initial Sample Size (n) and Experimental Conditions” Column (Column 2).  Group labeled “2” in “Initial Sample Size (n) and
                                                                                b
           Experimental Conditions” Column (Column 2).  P value for comparison of outcomes in two conditions. Compares only scores at follow-up because no
                                             c
           significant difference at baseline.  There was significant difference on the baseline evaluation.  Pain on walking, follow-up value estimated from graph
                                                                            e
                                  d
                                                                                                           h
           and no standard deviation provided.  Exact P value not provided in article.  Compares follow-up values, no difference on baseline measures.  Compares
                                                               g
                                     f
           change in scores.
                                                                                            Achilles Tendinopathy  |  135