
Page 143 - JSOM Winter 2018
P. 143
question was reduced from a possible score of 0 to 5 to a score analyses were also performed to determine the influence of
of 0 or 1. Thus, the maximum possible score was 28. Three industry involvement, type of analysis performed (per proto-
authors independently rated each of the selected articles. Af- col versus intention to treat), joint involved, dosage schedule,
ter the independent evaluation, the reviewers met to examine treatment duration, and methodological quality.
the other reviewers’ scores and reconcile differences. The final
consensus score of the three reviewers served as the method- The Comprehensive Meta-Analysis Statistical Package, ver-
ological quality score. Final scores were converted to a per- sion 3.2, was also used to construct funnel plots and calculate
centage of the total score by dividing the raters’ score for the Begg and Mazumdar correlations to examine publication bias.
article by 28 and multiplying by 100%. Publication bias based on funnel plots was assessed by plotting
the standard error of a study (driven primarily by sample size)
Summary Measure against the SMD. Studies with larger sample sizes tend to clus-
The summary measure was the standardized mean differences ter near the top of the plot and near the pooled SMD, whereas
(SMDs) for OA-related pain and joint-space changes. The smaller studies are generally near the bottom of the graph. If
SMDs were calculated from the pre- and post-treatment means publication bias was present, the bottom of the plot would
and standard deviations (SDs) as: show a higher concentration on one side because studies with
smaller samples were more likely to be published if they had
(pretreatment − post-treatment ) − larger effect sizes (SMD). The Begg and Mazumdar Test cal-
59
placebo placebo
(pretreatment – post-treatment ) / pooled SD. culated rank-order correlations between treatment effects and
gs gs
standard errors.
An SMD of zero indicated that GS and placebo had equiva-
lent effects, supporting the null hypothesis. On pain scales, a Results
reduction in pain was generally indicated by a reduction in the
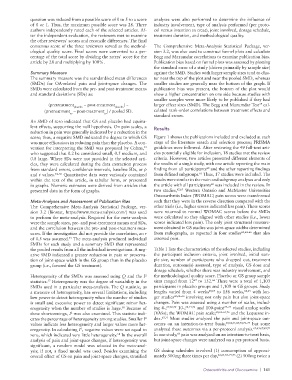
score; thus, a negative SMD indicated the degree to which GS Figure 1 shows the publications included and excluded at each
was more efficacious in reducing pain than the placebo. A con- stage of the literature search and selection process; PRISMA
vention for interpreting the SMD was proposed by Cohen, guidelines were followed. After reviewing the 49 full-text arti-
53
who suggested that 0.2 be considered small, 0.5 medium, and cles potentially eligible for inclusion, 18 studies met the review
0.8 large. Where SDs were not provided in the selected arti- criteria. However, two articles presented different elements of
cles, they were calculated during the data extraction process the results of a single study, with one article reporting the main
60
from standard errors, confidence intervals, baseline SDs, or p finding from all participants and the other reporting findings
61
and t values. 54–56 Quantitative data were variously contained from defined subgroups. Thus, 17 studies were included. The
within the text of the article, in tabular form, or presented results were similar in the main and subgroup analyses and only
in graphs. Numeric estimates were derived from articles that the article with all participants was included in the review. In
60
presented data in the form of graphs. two studies, 62,63 Western Ontario and McMaster Universities
Osteoarthritis Index (WOMAC) pain scores were transformed
Meta-Analyses and Assessment of Publication Bias such that they were in the reverse direction compared with the
The Comprehensive Meta-Analysis Statistical Package, ver- other trials (i.e., higher scores indicated less pain). These scores
sion 3.2 (Biostat, https://www.meta-analysis.com/) was used were returned to normal WOMAC scores before the SMDs
to perform the meta-analysis. Required for the meta-analysis were calculated so they aligned with other studies (i.e., lower
were the sample sizes, pre- and post-treatment means and SDs, scores indicated less pain). The only joint structural measure-
and the correlation between the pre- and post-treatment mea- ment obtained in GS studies was joint-space widths determined
sures. If the investigation did not provide the correlation, an r from radiographs, as reported in four studies 60,64–66 that also
of 0.5 was assumed. The meta-analysis produced individual assessed pain.
55
SMDs for each study and a summary SMD that represented
the pooled results from all the individual investigations. A neg- Table 1 lists the characteristics of the selected studies, including
ative SMD indicated a greater reduction in pain or preserva- the participant inclusion criteria, joint involved, initial sam-
tion of joint-space width in the GS group than in the placebo ple size, number of participants who dropped out, treatment
group (i.e., favored the GS treatment). duration, outcome(s) assessed, type of analysis, GS dose and
dosage schedule, whether there was industry involvement, and
Heterogeneity of the SMDs was assessed using Q and the I the methodological quality score. Placebo or GS group sample
2
67
statistics. Heterogeneity was the degree of variability in the sizes ranged from 12 to 152. There were a total of 1,103
66
57
SMDs used in a particular meta-analysis. The Q statistic, as participants in placebo groups and 1,109 in GS groups. Study
a measure of heterogeneity, has several limitations, including lengths varied from 4 weeks 68,69 to 156 weeks, 64,65 with lon-
low power to detect heterogeneity when the number of studies ger studies 60,64–66 involving not only pain but also joint-space
is small and excessive power to detect significant minor het- changes. Pain was assessed using a number of scales, includ-
erogeneity when the number of studies is large. Because of ing 4-, 67,68,70 10-, 66,71,72 and 100-point 73–75 visual analog scales
58
these shortcomings, I was also examined. This statistic indi- (VASs); the WOMAC pain scale; 60,62–65,76 and the Lequesne in-
2
cates the percentage of heterogeneity among studies. Smaller I dex. 69,77 Most studies analyzed the pain and joint-space out-
2
values indicate less heterogeneity and larger values more het- comes on an intention-to-treat basis, 60,64,65,68,70,72–77 but some
erogeneity. In calculating I , negative values were set equal to analyzed these outcomes via a per-protocol analysis. 62,63,67,69,71
2
zero, which indicated very little heterogeneity. In the overall In one study, pain was analyzed on an intention-to-treat basis,
66
58
analysis of pain and joint-space changes, if heterogeneity was but joint-space changes were analyzed on a per-protocol basis.
significant, a random model was selected in the meta-anal-
ysis; if not, a fixed model was used. Besides examining the GS dosing schedules involved (1) consumption of approxi-
overall effect of GS on pain and joint-space changes, stratified mately 500mg three times per day, 62,63,67–71,73 (2) 500mg twice a
Osteoarthritis and Glucosamine | 141