
Page 101 - JSOM Winter 2018
P. 101
responses for confidence (indications and technique) were A total of 96 simulated leg hemorrhage scenarios were man-
compared between groups. aged by 48 corpsmen. A total of 10 measurements for five
corpsmen from the TT group were discarded because of per-
fusion system failure on a single day of testing. The failure
Statistical Methodology
was not the result of the tourniquets or corpsmen application
Data were analyzed using OS X El Capitan 10.11.6/Micro- of the tourniquets. None of the PCT group measurements re-
soft Excel 15.24 (Microsoft Corp., www.microsoft.com). Uni- quired exclusion.
variate continuous data between two groups were compared
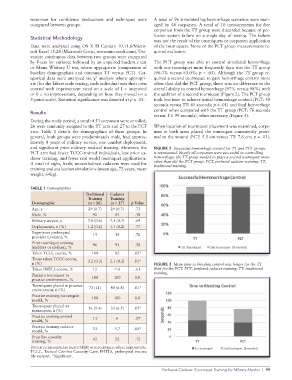
by F-test for variance followed by an unpaired Student t test The PCT group was able to control simulated hemorrhage
or Mann Whitney U test, where appropriate (comparison of with one tourniquet more frequently than was the TT group
baseline demographics and outcomes TT versus PCT). Cat- (96.0% versus 83.0%; p = .03). Although the TT group re-
egorical data were analyzed via χ analysis where appropri- quired a second tourniquet to gain hemorrhage control more
2
ate (for the Likert scale testing, each individual was their own often than did the PCT group, there was no difference in the
control with improvement rated on a scale of 1 = improved overall ability to control hemorrhage (97% versus 98%) with
or 0 = no improvement, depending on how they moved on a the addition of a second tourniquet (Figure 2). The PCT group
5-point scale). Statistical significance was denoted at p ≤ .05. took less time to achieve initial hemorrhage control (PCT: 39
seconds versus TT: 45 seconds; p = .01) and final hemorrhage
control when compared with the TT group (PCT: 76 seconds
Results
versus TT: 99 seconds), when necessary (Figure 3).
During the study period, a total of 53 corpsmen were enrolled;
26 were randomly assigned to the TT arm and 27 to the PCT When location of tourniquet placement was examined, corps-
arm. Table 1 details the demographics of these groups. In men in both arms placed the tourniquet consistently proxi-
general, both groups were predominately male, had approx- mal to the wound (PCT: 5.5 cm versus TT: 7.6 cm; p = .03).
imately 8 years of military service, one combat deployment,
and significant prior military medical training. However, the FIGURE 2 Successful hemorrhage control for TT and PCT groups
PCT arm had fewer TCCC-trained individuals, less prior ca- is represented. Nearly all corpsmen were successful in controlling
daver training, and fewer real world tourniquet applications. hemorrhage; the TT group needed to place a second tourniquet more
A total of eight, fresh, nonembalmed cadavers were used for often than did the PCT group. PCT, perfused-cadaver training; TT,
training and evaluation simulations (mean age, 72 years; mean traditional training.
weight, 64kg).
TABLE 1 Demographics
Traditional Cadaver
Training Training
Demographic (n = 26) (n = 27) p Value
Age, y 29 (0.7) 29 (0.7) .73
Male, % 92 83 .38
Military service, y 7.8 (0.6) 7.5 (0.7) .69
Deployments, n (%) 1.2 (0.2) 1.1 (0.2) .77
Experience prehospital
provider (civilian), % 15 19 .76
Prior tourniquet training
(military or civilian), % 96 93 .58
Taken TCCC course, % 100 82 .02*
Times taken TCCC course, 3.2 (0.3) 2.1 (0.3) .01*
n (%) FIGURE 3 Mean time to bleeding control was longer for the TT
Taken PHTLS course, % 12 7.4 .61 than for the PCT. PCT, perfused-cadaver training; TT, traditional
Placed a tourniquet in training.
practice environment, % 100 100 1.0
Tourniquets placed in practice
environment, n (%) 73 (11) 40 (6.8) .01*
Practice training mannequin
model, % 100 100 1.0
Tourniquets placed on 56 (9.4) 33 (6.5) .05*
mannequin, n (%)
Practice training animal 13 0 .07
model, %
Practice training cadaver 23 3.7 .04*
model, %
Prior live casualty
training, % 42 22 .12
Data arerepresented as mean (SEM) or percentages, where appropriate.
TCCC, Tactical Combat Casualty Care; PHTLS, prehospital trauma
life support. *Significant.
Perfused-Cadaver Tourniquet Training for Military Medics | 99