
Page 96 - JSOM Winter 2018
P. 96
test allowed us to measure how quickly and accurately each that the true magnitude of the effect at POST were substan-
participant could compute a simple mathematical problem. tially greater or smaller than PRE values and were assessed as
The four-digit number appeared on the top of the first column follows: <1%, almost certainly not; 1% to 5%, very unlikely;
of a three-column sheet of paper. Participants were provided 5% to 25%, unlikely; 25% to 75%, possibly; 75% to 95%,
the sheet of paper and asked to complete as many calculations likely; 95% to 99%, very likely; and >99%, almost certainly.
15
as possible in 2 minutes. The participant and timer/scorer sat If there was a >5% chance that the true value was either greater
opposite each other during testing. The answers to the calcu- or lesser, the effect was considered mechanistically unclear. In
lations were written beneath the initial number. Regardless of other words, the results of PSE supplementation were deemed
answer provided, participants were then required to subtract unclear if the values for its confidence interval overlapped
the number 7 from that new number. Participants were not multiple thresholds; therefore, the effect could be substantially
told if their answer was correct. The number of correct an- positive or negative, but there is a lack of data, large standard
swers was recorded. Intraclass correlations for this assessment deviations in the values, or both. The smallest nontrivial
14
have been determined in our laboratory to be R > 0.81. 12 change (i.e., the smallest worthwhile change), was set at 20%
of the grand standard deviation for all PRE values. Because of
14
Executive function and target engagement the small sample size, the determination of the effect of supple-
To assess executive function under pressure, participants were mentation on executive functioning during target acquisition
required to make a decision to shoot or not to shoot on the was made using the Fisher exact test.
basis of target recognition after undergoing a cognitive and
physical stress. Each participant entered the shooting range Results
alone. During each assessment period, the participant was re-
quired to put together a puzzle that contained the face of a All participants consumed either PSE or PL, as required, and
“terrorist.” After completing the puzzle, participants were re- compliance was 100%. The effect of supplementation on the
quired to sprint up and down three flights of stairs and return mean differences in change scores in jump power, eye-hand
to the shooting range. The puzzle was designed to provide an coordination, and reactive agility are presented in Table 1.
element of cognitive stress; the stair sprint provided an element Changes in both peak and mean jump power from PRE to
of physical stress. Upon re-entering the shooting range, the POST were unclear, suggesting that changes in jump power
participant was required to correctly recognize his target from were similar in participants consuming PSE and those in the
among 10 possible targets and deliver 10 shots (change of PL group. In addition, changes in eye-hand coordination (av-
magazine after five shots) to the head from 10m. The shooting erage reaction time and the number of hits) and reactive agility
instructor selected the puzzle randomly and the puzzle used (average reaction time per light and total time) were unclear
for the PRE assessment could have been different than that in participants consuming PSE compared with those in the PL
used for the POST assessment. Decision-making ability (i.e., group. Interestingly, close evaluation of the average reaction
recognize and engage the correct target) was assessed. In addi- time per light for reactive agility revealed that all five partic-
tion, the time required to construct the puzzle, sprint the stair, ipants in the PSE group had a reduced POST time, whereas
and engage the target was recorded. only three of five participants in the PL group experienced a
similar effect. Although the changes between the groups were
Statistical Analysis unclear, it is interesting to note that the average change was
To analyze group changes, magnitude-based inferential analy- 74% greater in the PSE group (−0.216 second) compared with
sis was used as an alternative to normal parametric statistics to the PL group (−0.124 second; Figure 1).
account for the small sample size per group. Findings of sev-
13
eral studies have supported magnitude-based inferences as an The effect of supplementation on the mean differences in the
alternative statistical tool to null-hypothesis testing for reduc- serial subtraction test and the VAS scores for energy, focus,
ing interpretation errors. 14,15 To make inferences about the true fatigue, and alertness are presented in Table 2. Changes in se-
effect of the nutrient intervention on the dependent variables, rial subtraction performance from PRE to POST were unclear,
data were analyzed using magnitude-based inferences, calcu- suggesting that changes in cognitive performance were similar
lated from 90% confidence intervals, as previously described. in participants in the PSE and PL groups after the operation.
14
Using a spreadsheet program, differences in dependent vari- However, changes in subjective feelings of energy, alertness,
ables from PRE to POST between groups were analyzed using and focus were “very likely,” “likely,” and “possibly better”
the p value from independent t tests to determine a mechanistic for PSE than PL, respectively. Comparisons between the PSE
inference. Qualitative inferences were based on the chances and PL groups for subjective feelings of fatigue were unclear.
16
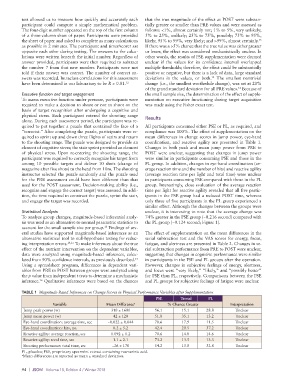
TABLE 1 Magnitude-Based Inferences on Change Scores in Physical Performance Variables after Supplementation
PSE Trivial PL
Variable Mean Difference a % Chance Greater Interpretation
Jump peak power (w) 310 ± 1600 56.1 15.1 28.8 Unclear
Jump mean power (w) 42 ± 120 51.8 35.1 13.2 Unclear
Eye-hand coordination: average time, sec −0.022 ± 0.044 70.6 17.9 11.5 Unclear
Eye-hand coordination: hits, no. 0.2 ± 5.2 42.4 20.5 37.2 Unclear
Reactive agility: average reaction, sec 0.092 ± 0.2 70.6 14.8 14.6 Unclear
Reactive agility: total time, sec 1.1 ± 2.1 73.2 13.5 13.3 Unclear
Shooting performance: total time, sec −26 ± 170 54.2 13.0 32.8 Unclear
PL, placebo; PSE, proprietary spearmint extract containing rosmarinic acid.
a Mean differences are reported as mean ± standard deviation.
94 | JSOM Volume 18, Edition 4 / Winter 2018