
Page 75 - JSOM Fall 2018
P. 75
Results SWAT-T
Data from 37 participants were recorded for all anatomic lo
Pneumatic TQ cations. There were statistically significant differences when
All 41 subjects had measurements at all anatomic sites with comparing length of TQ needed to achieve LOS between the
the pneumatic TQ, except one participant who was unable to RUA (35.473cm) and RFA (29.338cm), as well as the RTH
use the TQ successfully on the LUA. The only statistically sig (60.757cm) and RCA (40.236cm; p < .05 and p < .001). All
nificant differences among pressures required to achieve LOS mean SWAT pain values for proximal anatomic sites were sig
with the pneumatic TQ were between RTH (176.58mmHg) nificantly greater than for distal sites: LUA 2.68 versus LFA
and RCA (164.65mmHg; p < .05). There were no statistically 1.92 (p < .001), RUA 2.57 versus RFA 1.84 (p < .001) and
significant mean pain value differences among any proximal RTH 3.65 versus RCA 2.25 (p < .001). In total, pain was rated
versus distal anatomic sites for the pneumatic TQ. In total, as 1 or less by 27% of participants for LUA, 40.5% for the
pain was rated as 1 or less by 61% of participants for LUA, LFA, 27.0% for the RUA, 43.2 for the RFA, 18.9% for the
50% for LFA, 57.5% for RUA, 52.5% RFA, 15% for RTH, RTH, and 16.2% for the RCA. Pain was rated as 5 by 21.6%
and 25% for RCA. Pain was rated as 3 or 4 by 45% of partic of the SWAT population and as 3 or 4 by 35%.
ipants (Figures 4 and 5).
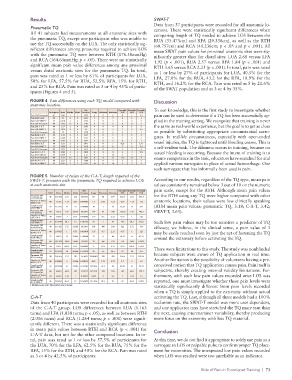
FIGURE 4 Pain differences using each TQ model compared with Discussion
anatomic location.
Std. Percentile Percentile Percentile To our knowledge, this is the first study to investigate whether
Participants Mean Median Mode Deviation Range Minimum Maximum 25% 50% 75%
Pain LUA Pneumatic 41 1.561 1 1 1.533 6 0 6 0 1 2.5 pain can be used to determine if a TQ has been successfully ap
Pain LUA C-A-T 40 1.5 1 0 1.633 7 0 7 0 1 2
Pain LUA SWAT-T 37 2.676 2 2 1.733 7 0 7 1 2 4 plied in the training setting. We recognize that training is never
Pain LFA Pneumatic 40 1.625 1.5 0 1.48 6 0 6 0 1.5 2
Pain LFA C-A-T 40 1.15 1 0 1.145 4 0 4 0 1 2 the same as realworld experience, but the goal is to get as close
Pain LFA SWAT-T 37 1.919 2 2 1.3 5 0 5 1 2 2.5 as possible by substituting appropriate circumstantial surro
Pain RUA Pneumatic 40 1.7 1 0 1.728 6 0 6 0 1 3
Pain RUA C-A-T 40 1.35 1 1 1.67 5 0 5 1 1 2 gates. In reallife circumstances, especially with openended
Pain RUA SWAT-T 37 2.568 2 2 1.757 8 0 8 1 2 3
Pain RFA Pneumatic 40 1.575 1 0 1.393 6 0 6 0 1 3 vessel injuries, the TQ is tightened until bleeding ceases. This is
Pain RFA C-A-T 40 1.15 1 1 1.075 5 0 5 0.25 1 1.75
Pain RFA SWAT-T 37 1.838 2 2 1.519 6 0 6 1 2 2.5 a selfevident task. The dilemma occurs in training, because no
Pain RTH Pneumatic 40 3.175 3 4 1.615 7 0 7 2 3 4
Pain RTH C-A-T 40 3.425 3 3 1.838 8 0 8 2 3 4.75 actual bleeding is occurring. Because the intent of training is to
Pain RTH SWAT-T 37 3.649 4 5 2.15 9 1 10 2 4 5
Pain RCA Pneumatic 40 2.75 2.5 2 1.971 8 0 8 1.25 2.5 4 ensure competence in the task, educators have searched for and
Pain RCA C-A-T 40 2.25 2 1 1.706 7 0 7 1 2 3
Pain RCA SWAT-T 37 3.541 3 2 2.142 10 0 10 2 3 5 applied various surrogates in place of actual hemorrhage. One
such surrogate that has informally been used is pain.
FIGURE 5 Number of twists of the C-A-T, length required of the
SWAT-T, pressures with the pneumatic TQ required to achieve LOS According to our results, regardless of the TQ type, mean pain
at each anatomic site. values consistently remained below 3 out of 10 on the numeric
pain scale, except for the RTH. Although mean pain values
Std. Percentile Percentile Percentile
Valid Mean Median Mode Deviation Range Minimum Maximum 25% 50% 75%
Pneumatic SBP 41 135.951 131 131 19.0735 89 90 179 123.5 131 149.5 for the RTH using any TQ were higher compared with other
LUA (mmHg)
Number of Twists 40 1.1625 1.25 0.75 0.429482 1.5 0.75 2.25 0.75 1.25 1.25 anatomic locations, their values were low clinically speaking
LUA C-A-T
Length needed 37 32.1351 33 35 10.87086 54 5 59 26.25 33 37.5 (RTH mean pain values: pneumatic TQ, 3.18; CAT, 3.42;
LUA SWAT-T
Pneumatic SBP 40 133.6 129 126.01 20.2381 114 95 209 123.25 129 145.5 SWATT, 3.65).
LFA (mmHg)
Number of Twists 40 1.0375 1 0.75 0.410402 1.75 0.5 2.25 0.75 1 1.25
LFA C-A-T
Length needed 37 27.6703 28.5 12 13.85733 76 5 81 18.5 28.5 34.25 Such low pain values may be too sensitive a predictor of TQ
LFA SWAT-T
Pneumatic SBP 40 137.125 133 131.01 24.1705 130 100 230 121 133 145
RUA (mmHg) efficacy; we believe, in the clinical sense, a pain value of 3
Number of Twists
RUA C-A-T 40 1.09625 1 0.75 0.416854 1.75 0.5 2.25 0.75 1 1.25 may be easily reached even by just the act of fastening the TQ
Length needed 37 35.473 32 29.001 15.09688 73 11 84 24.75 32 43.25
RUA SWAT-T around the extremity before activating the TQ.
Pneumatic SBP 40 132.375 126.5 119.01 17.8235 73 106 179 119 126.5 139.75
RFA (mmHg)
Number of Twists 40 1.075 0.875 0.75 0.442893 2 0.75 2.75 0.75 0.875 1.4375
RFA C-A-T There were limitations to this study. The study was nonblinded
Length needed 37 29.3378 30 30.00a 14.59978 92 4.5 96.5 21 30 35.5
RFA SWAT-T because subjects were aware of TQ application in real time.
Pneumatic SBP
RTH (mmHg) 40 176.575 173 187 35.3647 1250.661 192 310 158.5 173 187.75 Another limitation is the possibility of volunteers having a pre
Number of Twists 40 2.00625 2 1.500a 0.538539 0.29 1.75 2.75 1.5 2 2.5
RTH C-A-T
Length needed 37 60.7568 61 57.501 16.52381 273.036 67.5 96 49.75 61 73.25 conceived notion that TQ application causes pain. Pain itself is
RTH SWAT-T
Pneumatic SBP 40 164.65 166.5 147 25.9857 675.259 109 224 147 166.5 179.5 subjective, thereby creating internal validity limitations. Fur
RCA (mmHg)
Number of Twists thermore, with such low pain values recorded once LOS was
RCA C-A-T 40 1.2625 1.25 1 0.47687 0.227 2 2.5 1 1.25 1.5
Length needed 36 40.2361 36.75 27 18.63694 347.336 92.5 81 27 36.75 54.875 reported, one must investigate whether these pain levels were
RCA SWAT-T
statistically significantly different from pain levels recorded
1 Multiple modes exist. The smallest value is shown.
when a TQ is simply applied to the extremity without actual
C-A-T activating the TQ. Last, although all three models had a 100%
Data from 40 participants were recorded for all anatomic sites occlusion rate, the SWATT model was more user dependent,
of the CAT group. LOS differences between LUA (1.163 and one applicator may have stretched the TQ more taut than
turns) and LFA (1.038 turns; p < .05), as well as between RTH the next, causing interexaminer variability, thereby producing
(2.006 turns) and RCA (1.264 turns; p < .001) were signifi more force on the extremity with less TQ material.
cantly different. There was a statistically significant difference
in mean pain values between RTH and RCA (p < .001) for Conclusion
CAT data, but not for the other compared locations. In to
tal, pain was rated as 1 or less by 57.5% of participants for At this time, we do not find it appropriate to solely use pain as a
the LUA, 70% for the LFA, 62.5% for the RUA, 75% for the surrogate to LOS or palpable pulse to confirm proper TQ place
RFA, 15% for the RTH, and 40% for the RCA. Pain was rated ment for extremities. The unexpected low pain values recorded
as 3 or 4 by 42.5% of participants. when LOS was reached were too unreliable as an indicator.
Role of Pain in Tourniquet Training | 73