
Page 54 - Journal of Special Operations Medicine - Fall 2017
P. 54
precautions were observed, and the type of activity during Table 1 Study Subjects’ Baseline Characteristics
which the bite occurred. Medical bite-specific information in- Combat Soldiers Dogkeepers
cluded bite severity (superficial versus deep), serious bleeding, Characteristics (n = 64) (n = 14) p Value
fracture, need for intravenous (IV) antibiotic course, necessity Mean age, years 20.72 19.75 .002 a
of a surgical procedure (from approximation sutures to nerve Female subjects, % 10.4 57 .000 a
repair), and such complications as loss of sensation (in the Smokers, % 18% 29 .351
area proximal to bite), stiffness (in the joint proximal to bite), Mean height, cm 176 170 .032 a
and prominent scarring. In addition, participants were asked
to designate each bite location on a human body diagram. Mean weight, kg 73 67 .092
Mean time working a
with dogs, months 17.3 11.5 .023
Statistical analysis was performed using R 3.3.0 open-source
software. Baseline characteristics and bite-specific risk factors Mean time to the 6.7 3.9 .027 a
first bite, months
of combat soldiers and dogkeepers were compared using the χ
2
test for categorical variables and Welch t test for continuous Mean number of 1.89 1.85 .945
bites per person
variables. Significance level was set at p < .05. The informa- Persons having no
tion about time working with dogs and timing of each bite was bites, % 10.94 28.57 .085
transcribed in a counting process format for survival analysis. a Statistically significant at α of 0.05.
Subjects with missing data on any of the variables were ex-
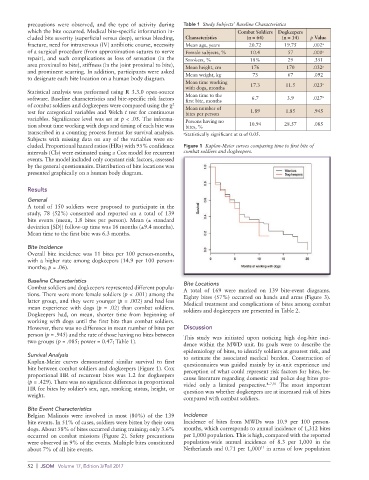
cluded. Proportional hazard ratios (HRs) with 95% confidence Figure 1 Kaplan-Meier curves comparing time to first bite of
intervals (CIs) were estimated using a Cox model for recurrent combat soldiers and dogkeepers.
events. The model included only constant risk factors, assessed
by the general questionnaire. Distribution of bite locations was
presented graphically on a human body diagram.
Results
General
A total of 150 soldiers were proposed to participate in the
study, 78 (52%) consented and reported on a total of 139
bite events (mean, 1.8 bites per person). Mean (± standard
deviation [SD]) follow-up time was 16 months (±9.4 months).
Mean time to the first bite was 6.3 months.
Bite Incidence
Overall bite incidence was 11 bites per 100 person-months,
with a higher rate among dogkeepers (14.9 per 100 person-
months; p = .06).
Baseline Characteristics Bite Locations
Combat soldiers and dogkeepers represented different popula- A total of 169 were marked on 139 bite-event diagrams.
tions. There were more female soldiers (p < .001) among the Eighty bites (57%) occurred on hands and arms (Figure 3).
latter group, and they were younger (p = .002) and had less Medical treatment and complications of bites among combat
mean experience with dogs (p = .02) than combat soldiers. soldiers and dogkeepers are presented in Table 2.
Dogkeepers had, on mean, shorter time from beginning of
working with dogs until the first bite than combat soldiers.
However, there was no difference in mean number of bites per Discussion
person (p = .945) and the rate of those having no bites between This study was initiated upon noticing high dog-bite inci-
two groups (p = .085; power = 0.47; Table 1).
dence within the MWD unit. Its goals were to describe the
epidemiology of bites, to identify soldiers at greatest risk, and
Survival Analysis to estimate the associated medical burden. Construction of
Kaplan-Meier curves demonstrated similar survival to first questionnaires was guided mainly by in-unit experience and
bite between combat soldiers and dogkeepers (Figure 1). Cox perception of what could represent risk factors for bites, be-
proportional HR of recurrent bites was 1.2 for dogkeepers cause literature regarding domestic and police dog bites pro-
(p = .429). There was no significant difference in proportional vided only a limited perspective. 4–7,10 The most important
HR for bites by soldier’s sex, age, smoking status, height, or question was whether dogkeepers are at increased risk of bites
weight.
compared with combat soldiers.
Bite Event Characteristics
Belgian Malinois were involved in most (80%) of the 139 Incidence
bite events. In 51% of cases, soldiers were bitten by their own Incidence of bites from MWDs was 10.9 per 100 person-
dogs. About 58% of bites occurred during training; only 3.6% months, which corresponds to annual incidence of 1,312 bites
occurred on combat missions (Figure 2). Safety precautions per 1,000 population. This is high, compared with the reported
were observed in 9% of the events. Multiple bites constituted population-wide annual incidence of 8.3 per 1,000 in the
11
about 7% of all bite events. Netherlands and 0.71 per 1,000 in areas of low population
52 | JSOM Volume 17, Edition 3/Fall 2017