
Page 30 - JSOM Spring 2023
P. 30
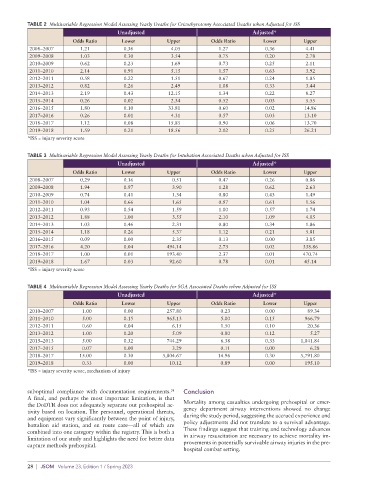
TABLE 2  Multivariable Regression Model Assessing Yearly Deaths for Cricothyrotomy Associated Deaths when Adjusted for ISS
                                       Unadjusted                                   Adjusted*
                         Odds Ratio      Lower          Upper         Odds Ratio       Lower        Upper
           2008–2007       1.21          0.36            4.05           1.27            0.36         4.41
           2009–2008       1.03          0.30            3.54           0.75            0.20         2.78
           2010–2009       0.62          0.23            1.69           0.73            0.25         2.11
           2011–2010       2.14          0.91            5.15           1.57            0.63         3.92
           2012–2011       0.58          0.22            1.51           0.67            0.24         1.85
           2013–2012       0.82          0.26            2.49           1.08            0.33         3.44
           2014–2013       2.19          0.43           12.15           1.34            0.22         8.27
           2015–2014       0.26          0.02            2.34           0.52            0.03         5.55
           2016–2015       1.80          0.10           33.81           0.60            0.02        14.86
           2017–2016       0.26          0.01            4.31           0.57            0.03        13.10
           2018–2017       1.12          0.08           15.85           0.90            0.06        13.70
           2019–2018       1.59          0.21           18.56           2.02            0.25        26.21
          *ISS = injury severity score

          TABLE 3  Multivariable Regression Model Assessing Yearly Deaths for Intubation Associated Deaths when Adjusted for ISS
                                       Unadjusted                                   Adjusted*
                         Odds Ratio      Lower          Upper         Odds Ratio       Lower        Upper
           2008–2007       0.29          0.16            0.51           0.47            0.26         0.86
           2009–2008       1.94          0.97            3.90           1.28            0.62         2.63
           2010–2009       0.74          0.41            1.34           0.80            0.43         1.49
           2011–2010       1.04          0.66            1.65           0.97            0.61         1.56
           2012–2011       0.93          0.54            1.59           1.00            0.57         1.74
           2013–2012       1.88          1.00            3.55           2.10            1.09         4.05
           2014–2013       1.03          0.46            2.31           0.80            0.34         1.86
           2015–2014       1.18          0.26            5.37           1.12            0.21         5.81
           2016–2015       0.09          0.00            2.35           0.13            0.00         3.85
           2017–2016       4.20          0.04          494.14           2.73            0.02        338.86
           2018–2017       1.00          0.01          193.40           2.37            0.01        470.74
           2019–2018       1.67          0.03           92.60           0.78            0.01        45.14
          *ISS = injury severity score


          TABLE 4  Multivariable Regression Model Assessing Yearly Deaths for SGA Associated Deaths when Adjusted for ISS
                                       Unadjusted                                   Adjusted*
                         Odds Ratio      Lower          Upper         Odds Ratio       Lower        Upper
           2010–2007        1.00         0.00          257.80            0.23           0.00         89.34
           2011–2010        5.00         0.15          965.13            5.00           0.15         966.79
           2012–2011        0.60         0.04            6.15            1.50           0.10         20.36
           2013–2012        1.00         0.20            5.09            0.80           0.12          5.27
           2015–2013        5.00         0.32          744.29            6.38           0.33       1,041.84
           2017–2015        0.07         0.00            3.29            0.11           0.00          6.28
           2018–2017       15.00         0.30         5,804.67          14.96           0.30       5,791.80
           2019–2018        0.33         0.00           10.12            0.89           0.00         195.10
          *ISS = injury severity score, mechanism of injury


          suboptimal compliance with documentation requirements.    Conclusion
                                                         38
          A final, and perhaps the most important limitation, is that
          the DoDTR does not adequately separate out prehospital ac-  Mortality among casualties undergoing prehospital or emer-
          tivity based on location. The personnel, operational threats,   gency department airway interventions showed no change
          and equipment vary significantly between the point of injury,   during the study period, suggesting the accrued experience and
          battalion aid station, and en route care—all of which are   policy adjustments did not translate to a survival advantage.
          combined into one category within the registry. This is both a   These findings suggest that training and technology advances
          limitation of our study and highlights the need for better data   in airway resuscitation are necessary to achieve mortality im-
          capture methods prehospital.                       provements in potentially survivable airway injuries in the pre-
                                                             hospital combat setting.

          28  |  JSOM   Volume 23, Edition 1 / Spring 2023