
Page 136 - JSOM Fall 2022
P. 136
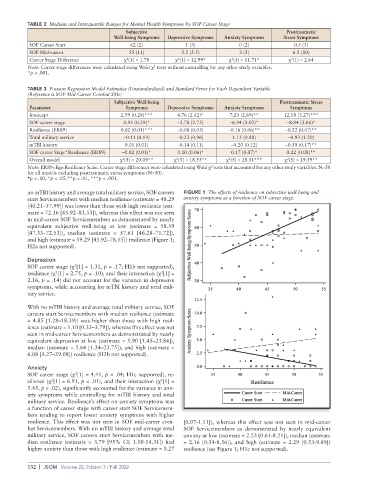
TABLE 2 Medians and Interquartile Ranges for Mental Health Symptoms by SOF Career Stage
Subjective Posttraumatic
Well-being Symptoms Depressive Symptoms Anxiety Symptoms Stress Symptoms
SOF Career Start 62 (2) 1 (3) 0 (2) 0.5 (3)
SOF Midcareer 55 (11) 5.5 (5.5) 3 (5) 6.5 (10)
2
2
Career Stage Difference χ (1) = 1.78 χ (1) = 12.99* χ (1) = 11.71* χ (1) = 2.64
2
2
Note: Career stage differences were calculated using Wald χ tests without controlling for any other study variables.
2
*p < .001.
TABLE 3 Poisson Regression Model Estimates (Unstandardized) and Standard Error for Each Dependent Variable
(Reference is SOF Mid-Career Combat SMs)
Subjective Well-being Posttraumatic Stress
Parameter Symptoms Depressive Symptoms Anxiety Symptoms Symptoms
Intercept 2.99 (0.28)*** 4.76 (2.42)* 7.23 (2.69)** 12.18 (3.27)***
SOF career stage 0.92 (0.39)* –3.78 (2.75) –6.94 (3.02)* –8.84 (3.66)*
Resilience (ER89) 0.02 (0.01)*** –0.08 (0.05) –0.16 (0.06)** –0.22 (0.07)**
Total military service –0.11 (0.14) –0.23 (0.96) 1.15 (0.88) –0.93 (1.20)
mTBI history 0.01 (0.01) –0.14 (0.11) –0.20 (0.12) –0.50 (0.17)**
SOF career Stage*Resilience (ER89) –0.02 (0.01)* 0.10 (0.06) + 0.17 (0.07)* 0.22 (0.08)**
2
2
2
2
Overall model χ (5) = 20.09** χ (5) = 18.55** χ (5) = 28.51*** χ (5) = 19.59**
2
Note: ER89=Ego Resiliency Scale. Career stage differences were calculated using Wald χ tests that accounted for any other study variables. N=58
for all models excluding posttraumatic stress symptoms (N=50).
+ p < .10, *p < .05, **p < .01, ***p < .001.
no mTBI history and average total military service, SOF careers FIGURE 1 The effects of resilience on subjective well-being and
start Servicemembers with median resilience (estimate = 48.29 anxiety symptoms as a function of SOF career stage.
[40.21–57.99]) was lower than those with high resilience (esti
mate = 72.16 [45.92–83.53]), whereas this effect was not seen
in midcareer SOF Servicemembers as demonstrated by nearly
equivalent subjective wellbeing at low (estimate = 58.59
[47.33–72.53]), median (estimate = 57.61 [46.28–71.72]),
and high (estimate = 59.29 [45.92–76.55]) resilience (Figure 1;
H2a not supported).
Depression
SOF career stage (χ [1] = 1.31, p = .17; H1b not supported),
2
resilience (χ [1] = 2.75, p = .10), and their interaction (χ [1] =
2
2
2.16, p = .14) did not account for the variance in depressive
symptoms, while accounting for mTBI history and total mili
tary service.
With no mTBI history and average total military service, SOF
careers start Servicemembers with median resilience (estimate
= 4.85 [1.28–18.39]) was higher than those with high resil
ience (estimate = 1.10 [0.32–3.79]), whereas this effect was not
seen in midcareer Servicemembers as demonstrated by nearly
equivalent depression at low (estimate = 5.90 [1.45–23.84]),
median (estimate = 5.64 [1.34–23.75]), and high (estimate =
6.08 [1.27–29.08]) resilience (H2b not supported).
Anxiety
SOF career stage (χ [1] = 4.41, p = .04; H1c supported), re
2
silience (χ [1] = 6.91, p < .01), and their interaction (χ [1] =
2
2
5.45, p = .02), significantly accounted for the variance in anx
iety symptoms while controlling for mTBI history and total
military service. Resilience’s effect on anxiety symptoms was
a function of career stage with career start SOF Servicemem
bers tending to report lower anxiety symptoms with higher
resilience. This effect was not seen in SOF midcareer com [0.071.11]), whereas this effect was not seen in midcareer
bat Servicemembers. With no mTBI history and average total SOF Servicemembers as demonstrated by nearly equivalent
military service, SOF careers start Servicemembers with me anxiety at low (estimate = 2.23 [0.618.21]), median (estimate
dian resilience (estimate = 3.79 [95% CI: 1.0014.31]) had = 2.16 [0.548.56]), and high (estimate = 2.29 [0.539.89])
higher anxiety than those with high resilience (estimate = 0.27 resilience (see Figure 1; H1c not supported).
132 | JSOM Volume 22, Edition 3 / Fall 2022