
Page 129 - 2022 Spring JSOM
P. 129
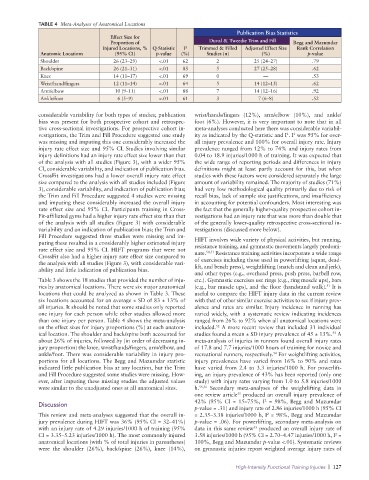
TABLE 4  Meta-Analyses of Anatomical Locations
                                                                              Publication Bias Statistics
                                     Effect Size for
                                     Proportion of                   Duval & Tweedie Trim and Fill  Begg and Mazumdar
                                   Injured Locations, %   Q-Statistic  I 2  Trimmed & Filled   Adjusted Effect Size   Rank Correlation
              Anatomic Locations       (95% CI)     p-value  (%)     Studies (n)       (%)            p-value
              Shoulder                26 (23–29)     <.01    62         2           25 (24–27)         .79
              Back/spine              26 (21–31)     <.01    85         5           27 (25–28)         .62
              Knee                    14 (11–17)     <.01    69         0              —               .53
              Wrist/hand/fingers      12 (11–14)     <.01    64         5           14 (12–15)         .62
              Arm/elbow                10 (9–11)     <.01    88         7           14 (12–16)         .92
              Ankle/foot               6 (5–9)       <.01    61         3            7 (6–8)           .52

              considerable variability for both types of studies; publication   wrist/hands/fingers (12%), arm/elbow (10%), and ankle/
              bias was present for both prospective cohort and retrospec-  foot (6%). However, it is very important to note that in all
              tive cross-sectional investigations. For prospective cohort in-    meta-analyses conducted here there was considerable variabil-
                                                                                               2
              vestigations, the Trim and Fill Procedure suggested one study   ity as indicated by the Q-statistic and I . I  was 95% for over-
                                                                                                 2
              was missing and imputing this one considerably increased the   all injury prevalence and 100% for overall injury rate. Injury
              injury rate effect size and 95% CI. Studies involving similar   prevalence ranged from 12% to 74% and injury rates from
              injury definitions had an injury rate effect size lower than that   0.04 to 18.9 injuries/1000 h of training. It was expected that
              of the analysis with all studies (Figure 3), with a wider 95%   the wide range of reporting periods and differences in injury
              CI, considerable variability, and indication of publication bias.   definitions might at least partly account for this, but when
              CrossFit investigations had a lower overall injury rate effect   studies with these factors were considered separately the large
              size compared to the analysis with all studies included (Figure   amount of variability remained. The majority of studies (71%)
              3), considerable variability, and indication of publication bias;   had very low methodological quality primarily due to risk of
              the Trim and Fill Procedure suggested 4 studies were missing   recall bias, lack of sample size justifications, and insufficiency
              and imputing these considerably increased the overall injury   in accounting for potential confounders. Most interesting was
              rate effect size and 95% CI. Participants training in Cross-  the fact that the generally higher-quality prospective cohort in-
              Fit-affiliated gyms had a higher injury rate effect size than that   vestigations had an injury rate that was more than double that
              of the analysis with all studies (Figure 3) with considerable   of the generally lower-quality retrospective cross-sectional in-
              variability and an indication of publication bias; the Trim and   vestigations (discussed more below).
              Fill Procedure suggested three studies were missing and im-  HIFT involves wide variety of physical activities, but running,
              puting these resulted in a considerably higher estimated injury   resistance training, and gymnastic movements largely predomi-
              rate effect size and 95% CI. HIFT programs that were not   nate. 50,51  Resistance training activities incorporate a wide range
              CrossFit also had a higher injury rate effect size compared to   of exercises including those used in powerlifting (squat, dead-
              the analysis with all studies (Figure 3), with considerable vari-  lift, and bench press), weightlifting (snatch and clean and jerk),
              ability and little indication of publication bias.
                                                                 and other types (e.g., overhead press, push press, barbell row,
              Table 3 shows the 18 studies that provided the number of inju-  etc.). Gymnastic exercises use rings (e.g., ring muscle ups), bars
              ries by anatomical locations. There were six major anatomical   (e.g., bar muscle ups), and the floor (handstand walk).  It is
                                                                                                            51
              locations that could be analyzed as shown in Table 3. These   useful to compare the HIFT injury data in the current review
              six locations accounted for an average ± SD of 83 ± 13% of   with that of other similar exercise activities to see if injury prev-
              all injuries. It should be noted that some studies only reported   alence and rates are similar. Injury incidence in running has
              one injury for each person while other studies allowed more   varied widely, with a systematic review indicating incidences
              than one injury per person. Table 4 shows the meta-analysis   ranged from 26% to 92% when all anatomical locations were
              on the effect sizes for injury proportions (%) at each anatom-  included.  A more recent review that included 31 individual
                                                                        52
              ical location. The shoulder and back/spine both accounted for   studies found a mean ± SD injury prevalence of 45 ± 13%.  A
                                                                                                              53
              about 26% of injuries, followed by (in order of decreasing in-  meta-analysis of injuries in runners found overall injury rates
              jury proportion) the knee, wrist/hands/fingers, arm/elbow, and   of 17.8 and 7.7 injuries/1000 hours of training for novice and
              ankle/foot. There was considerable variability in injury pro-  recreational runners, respectively.  For weightlifting activities,
                                                                                          54
              portions for all locations. The Begg and Mazumdar statistic   injury prevalences have varied from 16% to 90% and rates
              indicated little publication bias at any location, but the Trim   have varied from 2.4 to 3.3 injuries/1000 h. For powerlift-
              and Fill Procedure suggested some studies were missing. How-  ing, an injury prevalence of 43% has been reported (only one
              ever, after imputing these missing studies the adjusted values   study) with injury rates varying from 1.0 to 5.8 injuries/1000
              were similar to the unadjusted ones at all anatomical sites.  h. 55,56  Secondary meta-analyses  of the  weightlifting data in
                                                                 one review article  produced an overall injury prevalence of
                                                                               55
                                                                 42% (95% CI = 15–75%, I  = 98%, Begg and Mazumdar
                                                                                        2
              Discussion
                                                                 p-value = .31) and injury rate of 2.86 injuries/1000 h (95% CI
              This review and meta-analyses suggested that the overall in-  = 2.35–3.38 injuries/1000 h, I  = 98%, Begg and Mazumdar
                                                                                        2
              jury prevalence during HIFT was 36% (95% CI = 32–41%)   p-value = .06). For powerlifting, secondary meta-analysis on
              with an injury rate of 4.29 injuries/1000 h of training (95%   data in this same review  produced an overall injury rate of
                                                                                    55
              CI = 3.35–5.23 injuries/1000 h). The most commonly injured   3.58 injuries/1000 h (95% CI = 2.70–4.47 injuries/1000 h, I  =
                                                                                                               2
              anatomical locations (with % of total injuries in parentheses)   100%, Begg and Mazumdar p-value <.01). Systematic reviews
              were the shoulder (26%), back/spine (26%), knee (14%),   on gymnastic injuries report weighted average injury rates of
                                                                              High-Intensity Functional Training Injuries  |  127