
Page 125 - 2022 Spring JSOM
P. 125
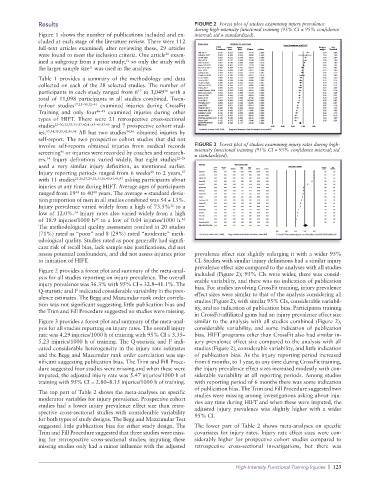
Results                                            FIGURE 2  Forest plot of studies examining injury prevalence
                                                                 during high-intensity functional training (95% CI = 95% confidence
              Figure 1 shows the number of publications included and ex-  interval; std = standardized).
              cluded at each stage of the literature review. There were 112
              full-text articles examined; after reviewing these, 29 articles
              were found to meet the inclusion criteria. One article  exam-
                                                       30
              ined a subgroup from a prior study;  so only the study with
                                          31
              the larger sample size  was used in the analysis.
                              31
              Table 1 provides a summary of the methodology and data
              collected on each of the 28 selected studies. The number of
                                              17
              participants in each study ranged from 6  to 3,049  with a
                                                       30
              total of 11,098 participants in all studies combined. Twen-
              ty-four studies 17,22–30,32–45  examined injuries during CrossFit
              Training and only four 46–49  examined injuries during other
              types of HIFT. There were 21 retrospective cross-sectional
              studies 22–30,32,33,35–37,40,41,43–45,47,49  and 7 prospective cohort stud-
              ies. 17,34,38,39,42,46,48  All but two studies 34,46  obtained injuries by
              self-report. The two prospective cohort studies that did not
              involve self-reports obtained injuries from medical records   FIGURE 3  Forest plot of studies examining injury rates during high-
              screening  or injuries were recorded by coaches and research-  intensity functional training (95% CI = 95% confidence interval; std
                     46
                                                                 = standardized).
                34
              ers.  Injury definitions varied widely, but eight  studies 22–29
              used a very similar  injury definition, as mentioned  earlier.
                                                            37
              Injury reporting periods ranged from 6 weeks  to 2 years,
                                                  48
              with 11 studies 23,26,27,29,32,33,36,40,43,45,47  asking participants about
              injuries at any time during HIFT. Average ages of participants
              ranged from 19  to 40  years. The average ± standard devia-
                          34
                               48
              tion proportion of men in all studies combined was 54 ± 13%.
                                                         32
              Injury prevalence varied widely from a high of 73.5%  to a
                         34
              low of 12.0%.  Injury rates also varied widely from a high
                                39
                                                            42
              of 18.9 injuries/1000 h  to a low of 0.04 injuries/1000 h.
              The methodological quality assessment resulted in 20 studies
              (71%) rated as “poor” and 8 (29%) rated “moderate” meth-
              odological quality. Studies rated as poor generally had signifi-
              cant risk of recall bias, lack sample size justifications, did not
              assess potential confounders, and did not assess injuries prior   prevalence effect size slightly enlarging it with a wider 95%
              to initiation of HIFT.                             CI. Studies with similar injury definitions had a similar injury
                                                                 prevalence effect size compared to the analyses with all studies
              Figure 2 provides a forest plot and summary of the meta-anal-
              ysis for all studies reporting on injury prevalence. The overall   included (Figure 2); 95% CIs were wider, there was consid-
              injury prevalence was 36.3% with 95% CI = 32.8–41.1%. The   erable variability, and there was no indication of publication
              Q-statistic and I  indicated considerable variability in the prev-  bias. For studies involving CrossFit training, injury prevalence
                          2
              alence estimates. The Begg and Mazumdar rank order correla-  effect sizes were similar to that of the analysis considering all
              tion was not significant suggesting little publication bias and   studies (Figure 2), with similar 95% CIs, considerable variabil-
              the Trim and Fill Procedure suggested no studies were missing.  ity, and no indication of publication bias. Participants training
                                                                 in CrossFit-affiliated gyms had an injury prevalence effect size
              Figure 3 provides a forest plot and summary of the meta-anal-  similar to the analysis with all studies combined (Figure 2),
              ysis for all studies reporting on injury rates. The overall injury   considerable variability, and some indication of publication
              rate was 4.29 injuries/1000 h of training with 95% CI = 3.35–  bias. HIFT programs other than CrossFit also had similar in-
                                                         2
              5.23 injuries/1000 h of training. The Q-statistic and I  indi-  jury prevalence effect size compared to the analysis with all
              cated considerable heterogeneity in the injury rate estimates   studies (Figure 2), considerable variability, and little indication
              and the Begg and Mazumdar rank order correlation was sig-  of publication bias. As the injury reporting period increased
              nificant suggesting publication bias. The Trim and Fill Proce-  from 6 months, to 1 year, to any time during CrossFit training,
              dure suggested four studies were missing and when these were   the injury prevalence effect sizes increased modestly with con-
              imputed, the adjusted injury rate was 5.47 injuries/1000 h of   siderable variability at all reporting periods. Among studies
              training with 95% CI = 2.80–8.15 injuries/1000 h of training.  with reporting period of 6 months there was some indication
                                                                 of publication bias. The Trim and Fill Procedure suggested two
              The top part of Table 2 shows the meta-analyses on specific   studies were missing among investigations asking about inju-
              moderator variables for injury prevalence. Prospective cohort   ries any time during HIFT and when these were imputed, the
              studies had a lower injury prevalence effect size than retro-  adjusted injury prevalence was slightly higher with a wider
              spective cross- sectional studies with considerable variability   95% CI.
              for both types of study designs. The Begg and Mazzumdar Test
              suggested little publication bias for either study design. The   The lower part of Table 2 shows meta-analyses on specific
              Trim and Fill Procedure suggested that three studies were miss-  covariates for injury rates. Injury rate effect sizes were con-
              ing for retrospective cross-sectional studies; imputing these   siderably higher for prospective cohort studies compared to
              missing studies only had a minor influence with the adjusted   retrospective cross-sectional investigations, but there was


                                                                              High-Intensity Functional Training Injuries  |  123