
Page 128 - 2022 Spring JSOM
P. 128
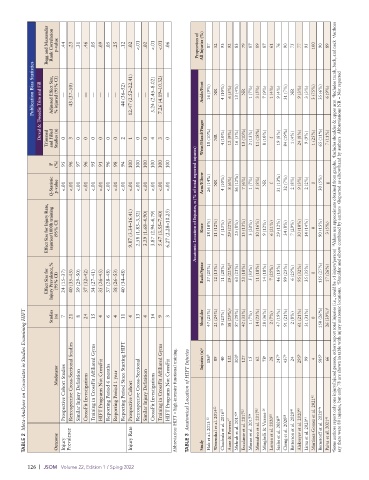
Begg and Mazumdar   Rank Correlation   p-value  .44  .23  .31  .46  .05  .09  .05  .25  .12  .02  <.01  .02  <.01  <.01  .06  Proportion of    All Injuries (%)  87  52  93  92  83  79  87  89  87  61  76  90  75  77  95  100  90  89


            Publication Bias Statistics  Duval & Tweedie Trim and Fill  Adjusted Effect Size,  % injured (95% CI)  —  43 (37–50)  —  —  —  —  —  —  44 (36–52)  12.47 (2.52–22.41)  —  —  5.24 (2.45–8.02)  7.26 (4.19–10.32)  —  Ankle/Foot  16 (9%)  NR  4 (10%)  6 (5%)  13 (4%)  NR  1 (7%)  3 (5%)  7 (9%)  1 (4%)  9 (4%)  31 (7%)  NR  9 (3%)  3 (3%)  3 (75%)  35 (6%)  6 (9%)


                    (%)
                  I 2 Trimmed    and Filled   Studies (n)  0  95  3  96  0  97  0  96  0  95  0  91  0  96  0  98  2  94  1  100  0  100  0  100  4  100  3  100  0  100  Wrist/Hand/Finger  18 (10%)  NR  4 (10%)  12 (9%)  16 (5%)  13 (10%)  2 (13%)  11 (18%)  8 (10%)  f  19 (8%)  84 (19%)  1 (4%)  24 (8%)  9 (9%)  1 (25%)  65 (11%)  7 (11%)
                  Q-Statistic  p-value  <.01  <.01  <.01  <.01  <.01  <.01  <.01  <.01  <.01  <.01  <.01  <.01  <.01  <.01  <.01  Anatomic Location of Injuries, n (% of total reported injuries)  Arm/Elbow  26 (14%)  NR  4 (10%)  8 (6%)  36 (12%)  7 (6%)  1 (7%)  5 (8%)  NR  f  31 (13%)  32 (7%)  2 (8%)  9 (3%)  2 (2%)  0  30 (5%)  g


                 Effect Size for Injury Rate,   injuries/1000h training   (95% CI)  9.87 (3.34–16.41)  2.58 (1.83–3.32)  3.29 (1.68–4.90)  3.87 (2.94–4.79)  5.47 (3.55–7.40)  6.27 (2.28–10.25)  Knee  18 (10%)  11 (12%)  5 (13%)  29 (22%)  25 (8%)  15 (13%)  3 (20%)  10 (16%)  9 (12%)  6 (21%)  29 (12%)  34 (8%)  7 (29%)  30 (10%)  14 (14%)  0  90 (15%)  3 (5%) a Some authors report only one injury/injured person, others report total injuries (i.e., could be >1 injury/person)


                 Effect Size for    Injury Prevalence,%   (95% CI)  24 (15–37)  40 (35–45)  39 (29–50)  37 (32–42)  34 (27–41)  35 (26–45)  37 (28–48)  38 (26–53)  40 (34–48)  Back/Spine  37 (20%)  12 (13%)  11 (28%)  29 (22%) d  63 (21%)  23 (18%)  5 (33%)  11 (18%)  14 (18%)  7 (25%)  46 (19%)  99 (23%)  6 (25%)  95 (32%)  35 (35%)  0  155 (27%)  17 (26%) say there were 80 injuries, but only 78 are shown in table with injury anatomic locations.   f Shoulder and elbow combin


                  Studies   (n)  7  21  8  24  15  4  6  4  11  4  13  4  14  9  3  Shoulder  47 (25%)  21 (24%)  9 (23%)  38 (29%) c  87 (29%)  42 (33%)  1 (7%)  14 (23%)  28 (36%)  2 (7%)  47 (19%)  91 (21%)  2 (8%)  61 (21%)  31 (31%)  0  150 (26%)  26 (39%) f
         TABLE 2  Meta-Analyses on Covariates in Studies Examining HIFT


                      Prospective Cohort Studies  Similar Injury Definition  CrossFit Investigations  HIFT Programs Not CrossFit  Reporting Period 6 months  Reporting Period 1 year  Prospective Cohort Retrospective Cross-Sectional  Similar Injury Definition  CrossFit Investigations  HIFT Programs Not CrossFit Abbreviation: HIFT = high-intensity functional training. TABLE 3  Anatomical Location of HIFT Injuries
                    Moderator  Retrospective Cross-Sectional Studies  Training in CrossFit Affiliated Gyms  Reporting Period Since Starting HIFT  Training in CrossFit Affiliated Gyms  Injuries (n) a  186 b  89  40  132  303 b  127  15  62  78 e  28  247 b  437 b  24  295 b  99  4  585 b  66


                    Outcome  Injury   Prevalence  Injury Rate      Study  Hak et al. 2013  32  Weisenthal et al. 2014 22  Chachula et al. 2016 33  Aune & Powers 47  Mehrab et al. 2017 24  Escalante et al. 2017 25  Moran et al. 2017 34  Montalvo et al. 2017 35  Minghelli & Vicente  26  Larsen et al. 2020 38  Szeles et al. 2020 39  Cheng et al. 2020 28  Batterson et al. 2020 48  Alekseyev et al. 2020 40  Lima et al. 2020 41 Martinez-Gomez et al. 2021 42  Bernstorff et al. 2021


          126  |  JSOM   Volume 22, Edition 1 / Sping 2022