
Page 46 - 2020 JSOM Winter
P. 46
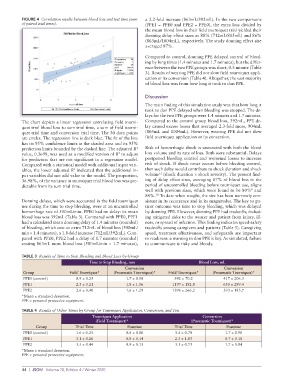
FIGURE 4  Correlation results between blood loss and test time (sum   a 2.2-fold increase (863mL/392mL). In the two comparisons
          of paired trial times).                            (PPE1 − PPE0 and PPE2 − PPE0), the extra loss divided by
                                                             the mean blood loss in their field tourniquet trial yielded their
                                                             donning delay effect sizes as 88% (712mL/805mL) and 86%
                                                             (863mL/1004mL), respectively. The study donning effect size
                                                             averaged 87%.

                                                             Compared to control, donning PPE delayed control of bleed-
                                                             ing by long times (1.4 minutes and 1.7 minutes), but the differ-
                                                             ence between the two PPE groups was short, 0.3 minute (Table
                                                             3). Results of wearing PPE did not slow field tourniquet appli-
                                                             cation or its conversion (Table 4). Altogether, the vast majority
                                                             of blood loss was from how long it took to don PPE.

                                                             Discussion
                                                             The main finding of this simulation study was that how long it
                                                             took to don PPE delayed when bleeding was stopped. The de-
                                                             lays for the two PPE groups were 1.4 minutes and 1.7 minutes.
          The chart depicts a linear regression correlating field tourni-  Compared to the control group blood loss, 392mL, PPE de-
          quet trial blood loss to sum trial time, a sum of field tourni-  lay caused excess losses that averaged 2.3-fold more, 904mL
          quet trial time and conversion trial time. The 30 data points   (805mL and 1004mL). However, wearing PPE did not slow
          are circles. The regression line is dark blue. The fit of the line   field tourniquet application or its conversion.
          has its 95% confidence limits in the shaded area and its 95%
                                                         2
          prediction limits bounded by the dashed line. The adjusted R    Risk of hemorrhagic shock is associated with both the blood
          value, 0.3698, was used as a modified version of R  to adjust   loss volume and its rate of loss. Both were substantial. Delays
                                                  2
          for predictors that are not significant in a regression model.   postponed bleeding control and worsened losses to increase
          Compared with a statistical model with additional input vari-  risk of shock. If shock onset occurs before bleeding control,
                                2
          ables, the lower adjusted R  indicated that the additional in-  then such delay would contribute to shock duration and shock
                                                                   12
          put variables did not add value to the model. The proportion,   volume  (shock duration × shock severity). The present find-
          36.98%, of the variance in tourniquet trial blood loss was pre-  ing of delay effect sizes, averaging 87% of blood loss in the
          dictable from its sum trial time.                  period of uncontrolled bleeding before tourniquet use, aligns
                                                             well with previous sizes, which were found to be 80%  and
                                                                                                         8
                                                             86%.  To date when sought, the size has been narrowly con-
                                                                 10
          Donning delays, which were accounted in the field tourniquet   sistent in its recurrence and in its magnitudes. The key to pa-
          use during the time to stop bleeding, were at an uncontrolled   tient outcome was time to stop bleeding, which was delayed
          hemorrhage rate of 500mL/min. PPE0 had no delay: its mean   by donning PPE. However, donning PPE had tradeoffs, includ-
          blood loss was 392mL (Table 3). Compared with PPE0, PPE1   ing mitigated risks to the wearer and patient from injury, ill-
          had a calculated mean donning delay of 1.4 minutes (rounded)   ness, or spread of infection. This finding indicates speed-safety
          of bleeding, which cost an extra 712mL of blood loss (500mL/  tradeoffs among caregivers and patients (Table 5). Caregiving
          min × 1.4 minutes), a 1.8-fold increase (712mL/392mL). Com-  speed, treatment effectiveness, and safeguards are important
          pared with PPE0, PPE2 had a delay of 1.7 minutes (rounded)   to readiness: a warning to don PPE is key. As simulated, failure
          costing 863mL more blood loss (500mL/min × 1.7 minutes),   to communicate is risky and bloody.

          TABLE 3  Results of Time to Stop Bleeding and Blood Loss by Group
                                      Time to Stop Bleeding, min                   Blood Loss, mL
                                                     Conversion                               Conversion
           Group              Field Tourniquet*  (Pneumatic Tourniquet)*  Field Tourniquet*  (Pneumatic Tourniquet)*
           PPE0 (control)       0.9 ± 0.25           1.7 ± 0.98          392 ± 70.2          417 ± 206.3
           PPE1                 2.3 ± 0.21           1.8 ± 1.06         1197 ± 192.8         650 ± 299.4
           PPE2                 2.6 ± 0.40           1.6 ± 1.29         1396 ± 266.2         333 ± 183.7
          *Mean ± standard deviation.
          PPE = personal protective equipment.
          TABLE 4  Results of Other Times by Group for Tourniquet Application, Conversion, and Test
                                       Tourniquet Application                        Conversion
                                         (Field Tourniquet)*                    (Pneumatic Tourniquet)*
                Group           Trial Time            Posttime           Trial Time            Posttime
           PPE0 (control)       1.6 ± 0.25           0.8 ± 0.06          3.4 ± 0.70           1.7 ± 0.90
           PPE1                 3.1 ± 0.26           0.8 ± 0.14          2.5 ± 1.03           0.7 ± 0.18
           PPE2                 3.5 ± 0.44           0.9 ± 0.13          3.3 ± 0.73           1.7 ± 0.84
          *Mean ± standard deviation.
          PPE = personal protective equipment.


          44  |  JSOM   Volume 20, Edition 4 / Winter 2020