
Page 45 - 2020 JSOM Winter
P. 45
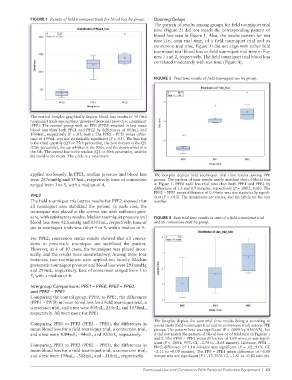
FIGURE 1  Results of field tourniquet trials for blood loss by group.  Donning Delays
                                                                 The pattern of results among groups for field tourniquet trial
                                                                 time (Figure 2) did not match the corresponding pattern of
                                                                 blood loss seen in Figure 1. Also, the results pattern for test
                                                                 time (i.e., sum trial time, of a field tourniquet trial and its
                                                                 conversion trial time, Figure 3) did not align with either field
                                                                 tourniquet trial blood loss or field tourniquet trial time in Fig-
                                                                 ures 1 and 2, respectively. The field tourniquet trial blood loss
                                                                 correlated moderately with test time (Figure 4).


                                                                 FIGURE 2  Trial time results of field tourniquet use by group.


              The vertical boxplot graphically depicts blood loss results of 30 field
              tourniquet trials among three groups of personal protective equipment
              (PPE). The control group with no PPE (PPE0) resulted in less mean
              blood loss than both PPE1 and PPE2 by differences of 805mL and
              1004mL, respectively (P < .05, both). The PPE2 – PPE1 mean differ-
              ence of 199mL was not statistically significant (P > .05). The box top
              is the third quartile (Q3 or 75th percentile), the box bottom is the Q1
              (25th percentile), the up whisker is the 95th, and the down whisker is
              the 5th. The central line is the median (Q2 or 50th percentile), and the
              diamond is the mean. The circle is a maximum.


              applied too loosely. In PPE1, median pressure and blood loss   The  boxplot  depicts  field  tourniquet  trial  time  results  among  PPE
              were 267mmHg and 553mL, respectively. Ease of conversion   groups. The pattern of time results nearly matched that of blood loss
              ranged from 3 to 5, with a median of 4.            in Figure 1. PPE0 took less trial time than both PPE1 and PPE2 by
                                                                 differences of 1.5 and 1.9 minutes, respectively (P = .0002, both). The
                                                                 PPE2 – PPE1 mean difference of 0.34min was not statistically signifi-
              PPE2                                               cant (P = .053). The maximums are circles, and the labels are the test
              The field tourniquet trial status results for PPE2 showed that   number.
              all tourniquet uses stabilized the patient. In each case, the
              tourniquet was placed at the correct site with sufficient pres-
              sure, with satisfactory results. Median tourniquet pressure and   FIGURE 3  Sum trial time results in sum of a field tourniquet trial
              blood loss were 421mmHg and 1305mL, respectively. Ease of   and its conversion trial by group.
              use in tourniquet trials was either 4 or 5, with a median of 4.

              For PPE2, conversion status results showed that all conver-
              sions  to pneumatic  tourniquet  use  stabilized  the patient.
              However, in 4 of 10 cases, the tourniquet was placed incor-
              rectly, and the results were unsatisfactory. Among these four
              instances, two tourniquets were applied too loosely. Median
              pneumatic tourniquet pressure and blood loss were 291mmHg
              and 289mL, respectively. Ease of conversion ranged from 3 to
              5, with a median of 4.

              Intergroup Comparisons: PPE1 – PPE0, PPE2 – PPE0,
              and PPE2 − PPE1
              Comparing the control group, PPE0, to PPE1, the differences
              (PPE1 − PPE0) in mean blood loss for a field tourniquet trial, a
              conversion trial, and a test were 805mL, 233mL, and 1038mL,
              respectively. All were more for PPE1.
                                                                 The  boxplot  depicts  the  sum  trial  time  results  being  a  summing  of
              Comparing PPE0 to PPE2 (PPE2 − PPE0), the differences in   paired trials (field tourniquet trial and its conversion trial) among PPE
              mean blood loss for a field tourniquet trial, a conversion trial,   groups. The pattern here was significant (P = .0008 by ANOVA), but
              and a test were 1004mL, −84mL, and 920mL, respectively.  it did not match the pattern of blood loss or of trial time in Figures 1
                                                                 and 2. The PPE0 − PPE2 mean difference of 1.69 minutes was signif-
              Comparing PPE1 to PPE2 (PPE2 − PPE1), the differences in   icant (P = .0001; 95% CI, −2.70 to –0.68 minute). Likewise, PPE1 −
                                                                 PPE2 difference of 1.10 minutes was significant (P = .02; 95% CI,
              mean blood loss for a field tourniquet trial, a conversion trial,   −2.11 to –0.09 minute). The PP0 – PPE1 mean difference of −0.60
              and a test were 199mL, −318mL, and −118mL, respectively.  minute was not significant (P = .17; 95% CI, −1.61 to –0.42 minute).

                                                            Tourniquet Use and Conversion With Personal Protective Equipment  |  43