
Page 82 - JSOM Summer 2020
P. 82
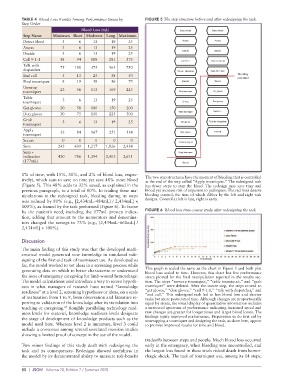
TABLE 4  Blood Loss Results Among Performance Strata by    FIGURE 5 The step structure before and after redesigning the task.
          Step Order
                                   Blood Loss (mL)                         Detect bleed   Detect bleed
           Step Name   Minimum  Short  Moderate  Long  Maximum
           Detect bleed    3      6    13      19     25                    Assess        Assess
           Assess          3      6    13      19     25
                                                                            Decide        Decide
           Decide          3      6    13      19     25
           Call 9-1-1     38     94    188    281    375
                                                                            Call 9-1-1   Grab tourniquet
           Talk with      75    188    375    563    750
           dispatcher
                                                                          Talk with dispatcher   Apply tourniquet
           End call        5     13    25      38     50                                           Bleeding
                                                                                                   controlled
           Find tourniquet   8   19    38      56     75                    End call      Secure
           Unwrap
           tourniquet     23     56    113    169    225                   Find tourniquet   Get gloves
           Table
           tourniquet      3      6    13      19     25                    Unwrap       Don gloves
           Get gloves     20     50    100    150    200
           Don gloves     30     75    150    225    300                   Table tourniquet   Call 9-1-1
           Grab            3      6    13      19     25
           tourniquet                                                       Get gloves   Talk with dispatcher
           Apply
           tourniquet     33     84    167    251    334                    Don gloves   End call
           Secure          0      0     0       0      0
                                                                           Grab tourniquet
           Sum           243    609  1,217   1,826  2,434
           Sum +                                                           Apply tourniquet
           indication    420    786  1,394   2,003  2,611
           (177mL)
                                                                            Secure
          1% of time, with 15%, 31%, and 2% of blood loss, respec-
          tively), which sum to save no time yet save 48% more blood   The two step structures have the moment of bleeding that is controlled
                                                             at the end of the step called “Apply tourniquet.” The redesigned task
          (Figure 5). This 48% adds to 32% saved, as explained in the   has fewer steps to stop the bleed. The redesign may save time and
          previous paragraph, to a total of 80%. In trialing these ma-  blood yet increase risk of exposure to pathogens. The red lines denote
          nipulations in the redesigned task, bleeding during its steps   bleeding control, the time of which differs by the left and right task
          was reduced by 80% (e.g., [2,434mL–484mL] / 2,434mL] ×   designs. Control at left is late, right is early.
          100%), as framed by the task performed (Figure 6). To frame
          by the patient’s need, including the 177mL prestep indica-  FIGURE 6  Blood loss time-course study after redesigning the task
          tion, adding that amount to the numerators and denomina-
          tors changed the savings to 73% (e.g., [2,434mL–661mL] /
          2,434mL] × 100%).

          Discussion

          The main finding of this study was that the developed math-
          ematical model generated new knowledge in simulated rede-
          signing of the first-aid task of tourniquet use. As developed so
          far, the model worked to vet ideas in a screening process while
          generating data on which to better characterize or understand   This graph is scaled the same as the chart in Figure 3 and both plot
                                                             blood loss scaled to time. However, this chart has five performance
          the issue of emergency caregiving for limb-wound hemorrhage.   strata plotted for the final manipulation reported in the results sec-
          The model calculations used introduce a way to screen hypoth-  tion. The steps “unwrap tourniquet,” “table tourniquet,” and “grab
          eses  in  what  managers  of  research  have  named  “knowledge   tourniquet” were deleted. After the secure step, the steps moved to
          readiness” at a level 2, screening hypotheses or ideas, on a scale   “get gloves,” “don gloves,” “call 9-1-1,” “talk with dispatcher,” and
          of maturation from 1 to 9, from observation and literature re-  “end call.” This redesigned task led to less blood loss and shorter
                                                             tasks but more postcontrol time. Although changes are proportionally
          porting to validation of the knowledge after its translation into   equal by strata, the visual display of quantitative information includes
                            27
          teaching or caregiving.  Roughly paralleling technology read-  a narrowed spectrum of performance indicating increased speed and
          iness levels for materiel, knowledge readiness levels designate   raw changes are greater for longer times and larger blood losses. The
          the stage of development of knowledge products such as the   findings typify improved performance. Preparation to do first aid by
                                                             unwrapping a tourniquet and designing the task, as done here, appear
          model used here. Whereas level 2 is immature, level 3 could   to promise improved results for time and blood.
          include a consensus among several unrelated manikin studies
          showing a limited proof of concept in the use of the model.
                                                             tradeoffs between steps and people. Much blood loss occurred
          Two minor findings of this study dealt with redesigning the   early in the emergency, when bleeding was uncontrolled, and
          task and its consequences. Redesigns showed usefulness in   the largest loss found in these trials risked death from hemor-
          the model by its demonstrated ability to measure risk-benefit   rhagic shock. The task of tourniquet use, among its 14 steps,


          80  |  JSOM   Volume 20, Edition 2 / Summer 2020