
Page 80 - JSOM Summer 2020
P. 80
We made a spreadsheet (Excel 2016; Microsoft, https://www FIGURE 1 Results of time proportions by step.
.microsoft.com/en-us/) with 14 column headers as the step
names. Each column had four cells for each stratum: the step
duration (seconds), step time proportion ([step duration / trial
duration] × 100%), step blood loss (step duration × blood-loss
rate for that step), and step blood-loss proportion ([step blood
loss / trial blood loss] × 100%). The minimum stratum had its
data entered. The data of other strata were multiplied by the
data of the base stratum. A pair of pie charts displayed a trial
with each of its steps as a slice. One pie was time. Another
was blood. To frame the speed of tourniquet use in a practical
way for learners, another pair of pie charts lumped results by
before and after the tourniquet first touched the patient.
Results
Results of the task trials were divided among 14 steps, which
had various durations (Table 2; Figure 1). The step of tourni-
quet application took 17% of the trial time, whereas securing
the tourniquet after bleeding control took the greatest propor- The pie chart presents the trial of tourniquet use beginning at the top
tion of time, 31%. A minority of the time (48% [17% + 31%, (12 o’clock); the steps occur in order clockwise. The slices of the pie
to apply the tourniquet plus secure it, respectively]) was spent are labeled with the step name and the proportion of time required at
after the tourniquet touched the patient. Most of the time each step.
(52%) was spent before the tourniquet touched the patient.
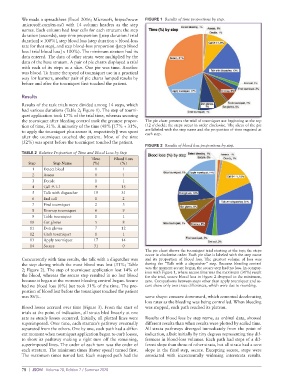
FIGURE 2 Results of blood loss proportions by step.
TABLE 2 Relative Proportion of Time and Blood Loss by Step
Time Blood Loss
Step Step Name (%) (%)
1 Detect bleed 1 1
2 Assess 1 1
3 Decide 1 1
4 Call 9-1-1 9 15
5 Talk with dispatcher 19 31
6 End call 1 2
7 Find tourniquet 2 3
8 Unwrap tourniquet 6 9
9 Table tourniquet 1 1
10 Get gloves 5 8
11 Don gloves 7 12
12 Grab tourniquet 1 1
13 Apply tourniquet 17 14
14 Secure 31 0
The pie chart shows the tourniquet trial starting at the top; the steps
occur in clockwise order. Each pie slice is labeled with the step name
Concurrently with time results, the talk with a dispatcher was and its proportion of blood loss. The greatest volume of loss was
the step during which the most blood was lost (31%; Table during the “Talk with a dispatcher” step. Because bleeding control
2; Figure 2). The step of tourniquet application lost 14% of was the moment secure began, the secure step had no loss. In compar-
ison with Figure 1, where secure time was the maximum (31%) result
the blood, whereas the secure step resulted in no lost blood for the trial, secure blood loss in Figure 2 dropped to the minimum,
because it began at the moment bleeding control began. Secure zero. Comparisons between steps other than apply tourniquet and se-
had no blood loss (0%) but took 31% of the time. The pro- cure show only two trace differences, which were due to rounding.
portion of blood lost before the tourniquet touched the patient
was 86%. same shape: concave downward, which connoted decelerating
loss rates as the bleeding was being controlled. When bleeding
Blood losses accrued over time (Figure 3). From the start of was stopped, each path reached its plateau.
trials at the point of indication, all strata bled linearly at one
rate as steady losses occurred. Initially, all plotted lines were Results of blood loss by step name, as ordinal data, showed
superimposed. Over time, each stratum’s pathway eventually different results than when results were plotted by scaled time.
separated from the others. One by one, each path had a differ- All strata pathways diverged immediately from the point of
ent moment when tourniquet application began to curb losses, indication, albeit initially by tiny degrees representing tiny dif-
to show its pathway making a right turn off the remaining, ferences in blood-loss volumes. Each path had steps of a dif-
superimposed lines. The order of each turn was the order of ferent slope than those of other strata, but all strata had a zero
each stratum. The minimum times (faster speed) turned first. slope in the final step, secure. Excepting secure, steps were
The maximum times turned last. Each mapped path had the associated with incrementally widening interstrata results.
78 | JSOM Volume 20, Edition 2 / Summer 2020