
Page 81 - JSOM Summer 2020
P. 81
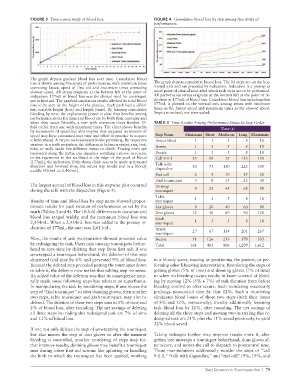
FIGURE 3  Time-course study of blood loss.         FIGURE 4  Cumulative blood loss by step among five strata of
                                                                 performances.


              The graph depicts gradual blood loss over time. Cumulative blood
              loss is shown among five strata of performances, with minimum times   The graph depicts cumulative blood loss. The 14 steps are on the hor-
              connoting fastest  speed  of first  aid and maximum  times  connoting   izontal axis and are preceded by indication. Indication is a prestep as
              slowest speed. All strata originate at the bottom left at the point of   onset point of clinical need after which task steps are to be performed.
              indication: 177mL of blood loss was the clinical need for tourniquet   All performance strata originate at the bottom left at the point of in-
              use in first aid. The graphed simulation results allowed its total blood   dication at 177mL of blood loss. Cumulative blood loss including that
              loss to be seen as the height of the plateau. Each path had a differ-  177mL  is  plotted  on  the  vertical  axis  among  strata  with  minimum
              ent, scalable height (loss) and length (time). By framing cumulative   times as the fastest speed and maximum times as the slowest speed.
              bleeding by time, the explanatory power is clear that benefits among   Steps are ordinal, not time scaled.
              performance strata for time and blood are by both their amounts and
              when they occur. Notably, a user with minimum times finishes 10-  TABLE 3  Time Results Among Performance Strata by Step Order
              fold earlier than one with maximum times. The chart shows benefits            Time (s)
              by increments of speed but also implies that acquired increments of
              speed may have consumed user time and effort in practice to acquire   Step Name   Minimum  Short  Moderate  Long  Maximum
              it beforehand. A return on investment looks promising. By respective   Detect bleed   1  3  5  8  10
              stratum in a path metaphor, the differences between sprint, run, trot,   Assess   1  3  5  8  10
              hike, or walk made five different mesas to climb. Tracing one’s eye
              backward along the paths, one imagines watching a movie in reverse   Decide   1  3  5   8     10
              to see regression to the trailhead at the edge of the pool of blood   Call 9-1-1   15  18  75  113  150
              (177mL), the indication. If the down climb was to be made in forward   Talk with
              direction and forward time, the return trip would end in a bloody   dispatcher  30  75  150  225  300
              puddle (420mL to 2,460mL).
                                                                 End call        2      5     10      15    20
                                                                 Find tourniquet   3    8     15      23    30
              The largest accrual of blood loss in this stepwise plot occurred   Unwrap
              during the talk with the dispatcher (Figure 4).    tourniquet      9     23     45      68    90
                                                                 Table
              Results of time and blood loss by step name showed propor-  tourniquet   1  3    5      8     10
              tionate results for each stratum of performance as set by the   Get gloves   8  20  40  60    80
              math (Tables 3 and 4). The 10-fold differences in duration and   Don gloves   12  30  60  90  120
              blood loss ranged widely, and the maximum blood loss was   Grab
              2,434mL. When a 2,434mL loss was added to the prestep in-  tourniquet   1  3     5      8     10
              dication of 177mL, the sum was 2,611mL.            Apply
                                                                 tourniquet      27    67    134     201   267
              Next, the results of task manipulation showed potential value   Secure   51  126  253  379   505
              by redesigning the task. Users may unwrap tourniquets before-  Total   161  403  806  1,209  1,612
              hand to save time by deleting that step from first aid. If one
              unwrapped a tourniquet beforehand, the deletion of that step
              shortened trial time by 6% and prevented 9% of blood loss.   in a bloody scene, moving or positioning the patient, or per-
              Because the deleted step preceded putting the tourniquet down   forming other lifesaving interventions. Reordering the steps of
              to table it, the deletion now makes that tabling step nonsense.   getting gloves (5% of time) and donning gloves (7% of time)
              An added value of the deletion was that its consequence natu-  to when no bleeding occurs results in faster control of bleed-
              rally made some following steps less relevant or superfluous.   ing by moving 12% (5% + 7%) of task duration from before
              In manipulating the task by reordering steps, if one moves the   bleeding control to after secure. Such reordering necessarily
              step of “find tourniquet” to after donning gloves, then another   prolongs postcontrol  time by that 12%. Such a reordering
              two steps, table tourniquet and grab tourniquet, may also be   eliminates blood losses of those two steps (with their losses
              deleted. The deletion of these two steps sum to 1% of time and   of 8% and 12%, respectively), thereby additionally lessening
              2% of blood loss, after rounding. The net savings of deleting   task blood loss by 21%, after rounding. The net savings of
              all three steps in trialing this redesigned task are 7% of time   deleting all the three steps and moving two in trialing this re-
              and 11% of blood loss.                             designed task are 21% plus the 11% saved previously, to yield
                                                                 32% blood saved.
              If one not only deletes the step of unwrapping the tourniquet
              but  also moves  the  step  of don  gloves  to after  the  moment   Taking redesigns further may improve  results more if, alto-
              bleeding is controlled, another reordering of steps may fur-  gether, one unwraps a tourniquet beforehand, dons gloves af-
              ther improve results; donning gloves may benefit a tourniquet   ter secure, and moves the call to dispatch to postcontrol time.
              user during other first-aid actions like splinting or handling   Those manipulations additionally reorder the steps of “call
              the limb to which the tourniquet has been applied, working   9-1-1,” “talk with dispatcher,” and “end call” (9%, 19%, and

                                                                                      Step Duration in Tourniquet Use  |  79