
Page 87 - JSOM Summer 2020
P. 87
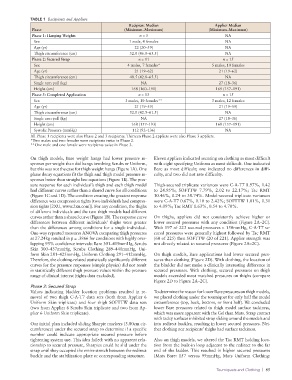
TABLE 1  Recipients and Appliers
                                                      Recipient Median                    Applier Median
              Phase                                 (Minimum–Maximum)                  (Minimum–Maximum)
              Phase 1: Hanging Weights                     n = 5                              NA
               Sex                                    1 male, 4 females                       NA
               Age (yr)                                  22 (20–59)                           NA
               Thigh circumference (cm)                52.0 (46.0–65.5)                       NA
              Phase 2: Secured Strap                      n = 11                             n = 15
               Sex                                    4 males, 7 females*               5 males, 10 females
               Age (yr)                                  21 (19–62)                        21 (19–62)
               Thigh circumference (cm)                48.5 (42.8–65.5)                       NA
               Single arm pull (kg)                        NA                              27 (18–36)
               Height (cm)                             168 (160–191)                      169 (157–191)
              Phase 3: Completed Application              n = 13                             n = 15
               Sex                                   3 males, 10 females**              3 males, 12 females
               Age (yr)                                  21 (19–59)                        21 (19–59)
               Thigh circumference (cm)                52.0 (42.5–61.5)                       NA
               Single arm pull (kg)                        NA                              27 (18–36)
               Height (cm)                             168 (157–193)                      168 (157–191)
               Systolic Pressure (mmHg)                 112 (92–136)                          NA
              All Phase 1 recipients were also Phase 2 and 3 recipients. Thirteen Phase 2 appliers were also Phase 3 appliers.
              *Two males and two females were recipients twice in Phase 2.
              **One male and one female were recipients twice in Phase 3.

              On thigh models, Bare weight hangs had lower pressure re-  Eleven appliers indicated securing on clothing as most difficult
              sponses per weight than did hangs involving Scrubs or Uniform,   with eight specifying Uniform as most difficult. One indicated
              but this was not the case for thigh weight hangs (Figure 1A). One   Bare as most difficult; one indicated no differences in diffi-
              phase decay equations fit the thigh and thigh model pressure re-  culty, and two did not rate difficulty.
              sponses better than straight line equations (Figure 1B). The pres-
              sure response for each individual’s thigh and each thigh model   Thigh-secured triplicate variances were C-A-T7 8.97%, 1.42
              had different curves rather than a shared curve for all conditions   to 24.95%; SOFTTW 7.79%, 2.02 to 22.17%; Tac RMT
              (Figure 1C and 1D). The condition creating the greatest response   10.46%, 0.24 to 38.74%. Model-secured triplicate variances
              difference was compression tights (two individuals had compres-  were C-A-T7 0.67%, 0.10 to 2.42%; SOFTTW 1.01%, 0.31
              sion tights [2XU, www.2xu.com]). For any condition, the thighs   to 4.09%; Tac RMT 1.63%, 0.54 to 4.70%.
              of different individuals and the two thigh models had different
              curves rather than a shared curve (Figure 1B). The response curve   On thighs, appliers did not consistently achieve higher or
              differences between different individuals’ thighs were greater   lower secured pressures with any condition (Figure 2A–2C).
              than the differences among conditions for a single individual.   With 197 of 223 secured pressures > 150mmHg, C-A-T7 se-
              One-way repeated measures ANOVA comparing thigh pressures   cured pressures were generally highest followed by Tac RMT
              at 27.24kg resulted in p = .3866 for conditions with highly over-  (60 of 225) then SOFTTW (20 of 221). Applier strength was
              lapping 95% confidence intervals: Bare 301–419mmHg, Scrubs   not directly related to secured pressures (Figure 2A–2C).
              Skin 300–437mmHg, Scrubs Clothing 289–440mmHg, Uni-
              form Skin 281–425mmHg, Uniform Clothing 291–412mmHg.   On thigh models, Bare applications had lower secured pres-
              Therefore, the clothing-related statistically significantly different   sures than clothing (Figure 2D). With clothing, the location of
              curves for the pressure responses (simple physics) did not result   the bladder did not make a clinically interesting difference in
              in statistically different thigh pressure values within the pressure   secured pressures. With clothing, secured pressures on thigh
              range of clinical interest (tights data excluded).  models exceeded most matched pressures on thighs (compare
                                                                 Figure 2D to Figure 2A–2C).
              Phase 2: Secured Strap
              Values indicating bladder location problems resulted in re-  To determine the reason for lower Bare pressures on thigh models,
              moval of two thigh C-A-T7 data sets (both from Applier 6   we placed clothing under the tourniquet for only half the model
              Uniform Skin triplicate) and four thigh SOFTTW data sets   circumference (top, back, bottom, or front half). We concluded
              (two from Applier 6 Scrubs Skin triplicate and two from Ap-  lower Bare pressures related to thigh model surface tackiness,
              plier 6 Uniform Skin triplicate).                  which was more apparent with the Gel than Mats. Strap contact
                                                                 with tacky surfaces inhibited strap sliding around the models and
              Our initial plan included sliding Sharpie markers (3.80cm cir-  into redirect buckles, resulting in lower secured pressures. Nei-
              cumference) under the secured strap to determine if a specific   ther clothing nor recipients’ thighs had surface tackiness.
              number could indicate appropriate secured pressure before
              tightening system use. This idea failed: with no apparent rela-  Also on thigh models, we altered the Tac RMT holding loca-
              tionship to secured pressure, Sharpies could be slid under the   tion from the built-in loop adjacent to the redirect to the far
              strap until they occupied the entire stretch between the redirect   end of the ladder. This resulted in higher secured pressures
              buckle and the stabilization plate or corresponding structure.  (Mats Bare: 157 versus 99mmHg, Mats Uniform Clothing:

                                                                                          Tourniquets and Clothing  |  85