
Page 88 - JSOM Summer 2020
P. 88
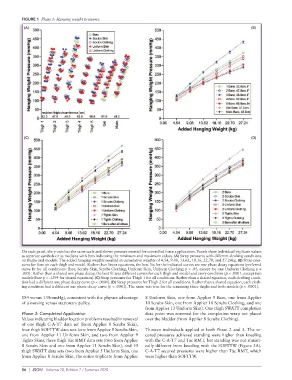
FIGURE 1  Phase 1: Hanging weight pressures.

           (A)                                                                                           (B)


           (C)                                                                                           (D)


          On each panel, the y-axis has the same scale and shows pressure exerted for controlled force applications. Panels show individual triplicate values
          as separate symbols or as medians with bars indicating the minimum and maximum values. (A) Strap pressures with different clothing conditions
          on thighs and models. The added hanging weights resulted in cumulative weights of 4.54, 9.08, 13.62, 18.16, 22.70, and 27.24kg. (B) Strap pres-
          sures for Bare on each thigh and model. Rather than linear equations, the best fits for the indicated curves are one phase decay equations (preferred
          curve fit for all conditions: Bare, Scrubs Skin, Scrubs Clothing, Uniform Skin, Uniform Clothing; p < .05, except for one Uniform Clothing p =
          .095). Rather than a shared one phase decay, the best fit was different curves for each thigh and model and every condition (p < .0001, except two
          models Bare p = .1294 for shared equation). (C) Strap pressures for Thigh 1 for all conditions. Rather than a shared equation, each clothing condi-
          tion had a different one phase decay curve (p < .0001). (D) Strap pressures for Thigh 2 for all conditions. Rather than a shared equation, each cloth-
          ing condition had a different one phase decay curve (p < .0001). The same was true for the remaining three thighs and both models (p < .0001).

          184 versus 139mmHg), consistent with the physics advantage   8 Uniform Skin, one from Applier 9 Bare, one from Applier
          of a moving versus stationary pulley.              10 Scrubs Skin, one from Applier 10 Scrubs Clothing, and one
                                                             from Applier 13 Uniform Skin). One thigh SWATT completion
          Phase 3: Completed Application                     data point was removed for the completion wrap not placed
          Values indicating bladder location problems resulted in removal   over the bladder (from Applier 8 Scrubs Clothing).
          of one thigh C-A-T7 data set (from Applier 8 Scrubs Skin),
          four thigh SOFTTW data sets (one from Applier 8 Scrubs Skin,   Thirteen individuals applied in both Phase 2 and 3. The se-
          one from Applier 11 Uniform Skin, and two from Applier 9   cured pressures achieved standing were higher than kneeling
          Tights Skin), three thigh Tac RMT data sets (two from Applier   with the C-A-T7 and Tac RMT, but standing was not statisti-
          8 Scrubs Skin and one from Applier 11 Scrubs Skin), and 10   cally different from kneeling with the SOFTTW (Figure 3A).
          thigh SWATT data sets (two from Applier 5 Uniform Skin, one   C-A-T7 secured pressures were higher than Tac RMT, which
          from Applier 8 Scrubs Skin, the entire triplicate from Applier   were higher than SOFTTW.


          86  |  JSOM   Volume 20, Edition 2 / Summer 2020