
Page 54 - JSOM Winter 2019
P. 54
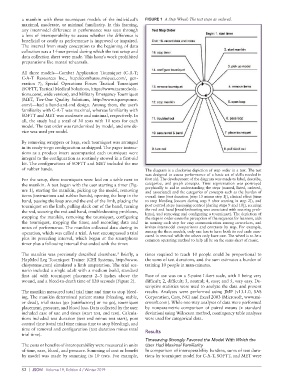
a manikin with three tourniquet models of the individual’s   FIGURE 1  A Step Wheel: The test steps as ordered.
          maximal, moderate, or minimal familiarity. In this framing,
          any intermodel difference in performance was seen through
          a lens of interoperability to assess whether the difference is
          beneficial or costly as performance is improved or impaired.
          The interval from study conception to the beginning of data
          collection was a 1-hour period during which the test setup and
          data collection sheet were made. This hour’s work prohibited
          preparations like mental rehearsals.

          All three models—Combat Application Tourniquet (C-A-T;
          C-A-T  Resources  Inc.,  http://combattourniquet.com/,  gen-
          eration 7), Special Operations Forces Tactical Tourniquet
          (SOFTT, Tactical Medical Solutions, https://www.tacmedsolu-
          tions.com/, wide version), and Military Emergency Tourniquet
          (MET, Tier-One Quality Solutions, http://www.tqsresponse.
          com/)—had a band-and-rod design. Among them, the user’s
          familiarity with C-A-T was maximal, whereas familiarity with
          SOFTT and MET was moderate and minimal, respectively. In
          all, the study had a total of 30 tests with 10 tests for each
          model. The test order was randomized by model, and one de-
          vice was used per model.

          By removing wrappers or bags, each tourniquet was arranged
          in its ready-to-go configuration as shipped. The paper instruc-
          tions as a product insert accompanied each tourniquet were
          integral to the configuration as routinely stowed in a first-aid
          kit. The configurations of SOFTT and MET included the use
          of rubber bands.                                   The diagram is a clockwise depiction of step order in a test. The test
                                                             was designed to assess performance of a basic set of skills needed in
          For the setup, three tourniquets were laid on a table next to   first aid. The development of the diagram was made to label, describe,
          the manikin. A test began with the user starting a timer (Fig-  categorize, and graph concepts. Time segmentation was portrayed
          ure 1), starting the manikin, picking up the model, removing   graphically to aid in understanding the steps (named, listed, ordered,
                                                             and associated) and the categories of concepts such as the burden of
          items (instructions and rubber bands), opening the loop in the   overall time (test duration [step 15 minus step 1]), clinical effect (time
          band, passing the loop around the end of the limb, placing the   to stop bleeding [occurs during step 9 after starting in step 2]), and
          tourniquet on the limb, pulling slack out of the band, turning   post control steps (assessing control [during steps 9 and 10]), securing
          the rod, securing the rod and band, troubleshooting problems,   the rod and band [troubleshooting was associated with securing prob-
          stopping  the  manikin,  removing  the  tourniquet,  configuring   lems], and removing and configuring a tourniquet). The depiction of
                                                             the steps in order eases the perception of the sequence for learners, aids
          the tourniquet, stopping the timer, and recording data and   in naming each step for easy communication among coworkers, and
          notes of performance. The manikin collected data during its   invites intermodel comparisons and contrasts by step. For example,
          operation, which was called a trial. A test encompassed a trial   among the three models, only one has to have both its rod ends unse-
          plus its preceding interval, which began at the smartphone   cured in removal while the others only have one. The wheel is to be a
                                                             common operating method to help all be on the same sheet of music.
          timer plus a following interval that ended with the timer.
          The manikin was previously described elsewhere.  Briefly, a   times required to teach 10 people could be proportional to
                                                  9
          HapMed Leg Tourniquet Trainer (CHI Systems, http://www.  the sums of test durations, and the sum estimates a burden of
          chisystems.com) simulated a limb amputation. The trial sce-  training 10 people in man-minutes.
          nario included a single adult with a medium build, standard
          first aid with tourniquet placement 2–3 inches above the   Ease of use was on a 5-point Likert scale, with 1 being very
          wound, and a bleed-to-death time of 120 seconds (Figure 2).  difficult; 2, difficult; 3, neutral; 4, easy; and 5, very easy. De-
                                                             scriptive statistics were used to analyze the data and present
          The manikin measured total trial time and time to stop bleed-  results. Analyses were performed using JMP (v13.1.0, SAS
          ing. The manikin determined patient status (bleeding, stable,   Corporation, Cary, NC) and Excel 2003 (Microsoft, www.mi-
          or dead), trial status (go [satisfactory] or no go), tourniquet   crosoft.com). While one-way analyses of data were performed
          placement, pressure, and blood loss. Data collected by the user   by nonparametric comparison of paired means (± standard
          included ease of use and times (start test, end test). Calcula-  deviation) using Wilcoxon method, contingency table analyses
          tions included test duration (test end minus test start), post   were used for categorical data.
          control time (total trial time minus time to stop bleeding), and
          time of removal and configuration (test duration minus total   Results
          trial time).
                                                             Timesaving Strongly Favored the Model With Which the
          The costs or benefits of interoperability were measured in units   User Had Maximal Familiarity
          of time, ease, blood, and pressure. Summing of cost or benefit   In comparison of interoperability burdens, sums of test dura-
          by model was made by summing its 10 tests. For example,   tions by tourniquet model for C-A-T, SOFTT, and MET were


          52  |  JSOM   Volume 19, Edition 4 / Winter 2019