
Page 70 - JSOM Summer 2018
P. 70
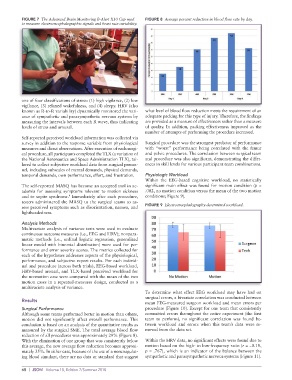
FIGURE 7  The Advanced Brain Monitoring B-Alert X10 Cap used   FIGURE 8  Average percent reduction in blood flow rate by day.
          to measure electroencephalographic signals and heart rate variability.


          one of four classifications of stress: (1) high vigilance, (2) low
          vigilance, (3) relaxed wakefulness, and (4) sleepy. HRV (also
          known as R-to-R variability) dynamically monitored the vari-  what level of blood flow reduction meets the requirement of an
          ance of sympathetic and parasympathetic nervous systems by   adequate packing for this type of injury. Therefore, the findings
          measuring the intervals between each R wave, thus indicating   are provided as a measure of effectiveness rather than a measure
          levels of stress and arousal.                      of quality. In addition, packing effectiveness improved as the
                                                             number of attempts of performing the procedure increased.
          Self-reported perceived workload information was collected via
          survey in addition to the response variable from physiological   Surgical procedure was the strongest predictor of performance
          measures and direct observations. After execution of each surgi-  with “worst” performance being correlated with the femur
          cal procedure, all participants completed the TLX (a variation of   and pelvic procedures. The correlation between surgical team
          the National Aeronautics and Space Administration TLX), tai-  and procedure was also significant, demonstrating the differ-
          lored to collect subjective workload data from surgical person-  ences in skill levels for various participant team combinations.
          nel, including subscales of mental demands, physical demands,
          temporal demands, own performance, effort, and frustration.  Physiologic Workload
                                                             Within the EEG-based cognitive  workload, no statistically
          The self-reported MASQ has become an accepted tool in ac-  significant main effect was found for motion condition (p =
          ademia for assessing symptoms relevant to motion sickness   .002, no motion condition versus the mean of the two motion
          and to sopite syndrome.  Immediately after each procedure,   conditions; Figure 9).
                             9
          testers administered the MASQ to the surgical teams to as-
          sess perceived symptoms such as disorientation, nausea, and   FIGURE 9  Electroencephalography-determined workload.
          lightheadedness.

          Analysis Methods
          Multivariate analysis of variance tests were used to evaluate
          continuous outcome measures (i.e., EEG and HRV); nonpara-
          metric methods (i.e., ordinal logistic regression, generalized
          linear model with binomial distribution) were used for per-
          formance and error severity scores. The metrics collected for
          each of the hypotheses addresses aspects of the physiological,
          performance, and subjective report results. For each individ-
          ual and procedure (across both trials), EEG-based workload,
          HRV-based arousal, and TLX-based perceived workload for
          the no-motion case were compared with the mean of the two
          motion cases in a repeated-measures design, conducted as a
          multivariate analysis of variance.
                                                             To determine what effect EEG workload may have had on
                                                             surgical errors, a bivariate correlation was conducted between
          Results
                                                             mean EEG-measured surgeon workload and mean errors per
          Surgical Performance                               procedure (Figure 10). Except for one team that consistently
          Although some teams performed better in motion than others,   committed errors throughout the entire experiment (the first
          motion did not significantly affect overall performance. This   team to perform), no significant correlation was found be-
          conclusion is based on an analysis of the quantitative results as   tween  workload  and errors  when  this  team’s  data were  re-
          measured by the surgical SME. The total average blood flow   moved from the data set.
          reduction of all procedures was approximately 29% (Figure 8).
          With the elimination of one group that was consistently below   Within the HRV data, no significant effects were found due to
          this average, the new average flow reduction becomes approxi-  motion based on the high- to low-frequency ratio (r = −0.18,
          mately 35%. In either case, because of the use of a noncoagulat-  p = .767), which is an indicator of the balance between the
          ing blood simulant, there are no data or standard that suggest   sympathetic and parasympathetic nervous systems (Figure 11).


          68  |  JSOM   Volume 18, Edition 2/Summer 2018