
Page 44 - JSOM Spring 2018
P. 44
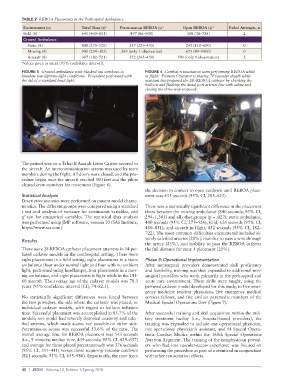
TABLE 2  REBOA Placements in the Prehospital Ambulance
           Environment (n)         Total Time (s)   a  Percutaneous REBOA (s) a  Open REBOA (s) a  Failed Attempts, n
           Field (8)               641 (400–851)       497 (86–908)           388 (38–738)            2
           Ground Ambulance
            Static (8)             408 (275–526)      337 (229–445)           245 (110–600)           0
            Moving (4)             900 (294–385)   369 (only 1 observation)   675 (49–1400)           0
            Aircraft (8)           387 (182–721)      352 (245–458)       590 (only 1 observation)    2
          a Values given as mean (95% confidence interval).
          FIGURE 5  Ground ambulance with blacked-out windows to   FIGURE 6  Combat resuscitation team performing REBOA while
          simulate low-light/no-light conditions.  Procedure performed with   in flight.  Primary Operator is placing 7F vascular sheath while
          the aid of a standard head light.                  assistant has prepared the ER-REBOA catheter by checking the
                                                             balloon and flushing the distal port arterial line with saline and
                                                             closing the three-way stopcock.


          The patient was on a Talon II Assault Litter Carrier secured to
          the aircraft. An intercommunication system was used by team
          members during the flight. All doors were closed, and the pro-
          cedure began once the aircraft reached 500 feet and the pilots
          cleared crew members for movement (Figure 6).
                                                             the decision to convert to open cutdown until REBOA place-
          Statistical Analysis                               ment was 455 seconds (95% CI, 285–625).
          Descriptive statistics were performed on patient model charac-
          teristics. The different groups were compared using a standard   There was a statistically significant difference in the placement
          t test and analysis of variance for continuous variables, and   times between the moving ambulance (840 seconds; 95% CI,
          χ  test for categorical variables. The statistical data analysis   294–1,385) and all other groups (p = .027): static ambulance,
           2
          was performed using JMP software, version 10 (SAS Institute,   400 seconds (95% CI, 275–526); field, 626 seconds (95% CI,
          https://www.sas.com).                              400–851); and aircraft in flight, 452 seconds (95% CI, 182–
                                                             722). The most common difficulties encountered included se-
                                                             verely calcified arteries (28%), inability to pass a wire through
          Results
                                                             the artery (25%), and inability to pass the REBOA catheter
          There were 28 REBOA catheter placement attempts in 14 per-  the full distance for zone 1 placement (21%).
          fused cadaver models in the nonhospital setting. There were
          eight placements in a field setting, eight placements in a static   Phase 3: Operational Implementation
          ambulance (four under normal light and four with no ambient   After  nonsurgical providers  demonstrated  skill proficiency
          light, performed using headlamps), four placements in a mov-  and feasibility, training was then expanded to additional non-
          ing ambulance, and eight placements inflight while in the UH-  surgical providers who work primarily in the prehospital and
          60 aircraft. The average age of the cadaver models was 78.3   acute care environment.  These skills were taught, using the
          years (95% confidence interval [CI], 74–82.5).     perfused cadaver model developed for this study, to five emer-
                                                             gency medicine resident physicians, five emergency medical
          No statistically significant differences were found between   services fellows, and five civilian paramedic members of the
          the two providers, the side where the catheter was placed, or   Medical Special Operations Unit (Figure 7).
          individual  cadaver models,  with regard  to  balloon inflation
          time. Successful placement was accomplished in 85.7% of the   After successful training and skill acquisition within the mili-
          models; one model had severely distorted anatomy and calci-  tary  treatment  facility  (i.e.,  hospital-based  providers),  the
          fied arteries, which made access not possible on either side.   training was expanded to include one operational physician,
          Percutaneous access was successful 53.6% of the time. The   one operational physician’s assistant, and 14 Special Opera-
          overall average time for REBOA placement was 543 seconds   tions Combat Medics within the 160th Special Operations
          (i.e., 9 minutes; median time, 439 seconds; 95% CI, 429–657)   Aviation Regiment. The training of the nonphysician provid-
          and average for those placed percutaneously was 376 seconds   ers who had less vascular-access experience was focused on
          (95% CI, 311–441) versus those requiring vascular cutdown   performing the procedure as part of a team and in conjunction
          (821 seconds; 95% CI, 655–986). Importantly, the time from   with other resuscitation efforts.


          40  |  JSOM   Volume 18, Edition 1/Spring 2018