
Page 63 - Journal of Special Operations Medicine - Fall 2017
P. 63
effect size. With 64 subjects per device, the investigators would
be able to detect an effect size of 0.5 SD; with 26 subjects per
device, an effect size of 0.8 SD would be detectable.
Results
A total of 89 Medics were enrolled in the study and completed
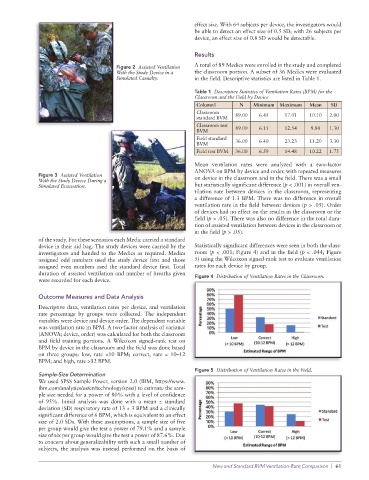
Figure 2 Assisted Ventilation
With the Study Device in a the classroom portion. A subset of 36 Medics were evaluated
Simulated Casualty. in the field. Descriptive statistics are listed in Table 1.
Table 1 Descriptive Statistics of Ventilation Rates (BPM) for the
Classroom and the Field by Device
Column1 N Minimum Maximum Mean SD
Classroom
standard BVM 89.00 6.45 17.01 10.10 2.00
Classroom test 89.00 6.15 12.54 8.80 1.30
BVM
Field standard 36.00 6.40 23.23 11.20 3.30
BVM
Field test BVM 36.00 6.59 14.48 10.22 1.75
Mean ventilation rates were analyzed with a two-factor
ANOVA on BPM by device and order, with repeated measures
Figure 3 Assisted Ventilation on device in the classroom and in the field. There was a small
With the Study Device During a
Simulated Evacuation. but statistically significant difference (p < .001) in overall ven-
tilation rate between devices in the classroom, representing
a difference of 1.3 BPM. There was no difference in overall
ventilation rate in the field between devices (p > .05). Order
of devices had no effect on the results in the classroom or the
field (p > .05). There was also no difference in the total dura-
tion of assisted ventilation between devices in the classroom or
in the field (p > .05).
of the study. For these scenarios each Medic carried a standard
device in their aid bag. The study devices were carried by the Statistically significant differences were seen in both the class-
investigators and handed to the Medics as required. Medics room (p < .001; Figure 4) and in the field (p < .044; Figure
assigned odd numbers used the study device first and those 5) using the Wilcoxon signed-rank test to evaluate ventilation
assigned even numbers used the standard device first. Total rates for each device by group.
duration of assisted ventilation and number of breaths given
were recorded for each device. Figure 4 Distribution of Ventilation Rates in the Classroom.
Outcome Measures and Data Analysis
Descriptive data, ventilation rates per device, and ventilation
rate percentage by groups were collected. The independent
variables were device and device order. The dependent variable
was ventilation rate in BPM. A two-factor analysis of variance
(ANOVA; device, order) was calculated for both the classroom
and field training portions. A Wilcoxon signed-rank test on
BPM by device in the classroom and the field was done based
on three groups: low, rate <10 BPM; correct, rate = 10–12
BPM; and high, rate >12 BPM.
Figure 5 Distribution of Ventilation Rates in the Field.
Sample-Size Determination
We used SPSS Sample Power, version 2.0 (IBM, https://www.
ibm.com/analytics/us/en/technology/spss/) to estimate the sam-
ple size needed for a power of 80% with a level of confidence
of 95%. Initial analysis was done with a mean ± standard
deviation (SD) respiratory rate of 13 ± 3 BPM and a clinically
significant difference of 6 BPM, which is equivalent to an effect
size of 2.0 SDs. With these assumptions, a sample size of five
per group would give the test a power of 79.1% and a sample
size of six per group would give the test a power of 87.6%. Due
to concern about generalizability with such a small number of
subjects, the analysis was instead performed on the basis of
New and Standard BVM Ventilation-Rate Comparison | 61