
Page 63 - Journal of Special Operations Medicine - Spring 2017
P. 63
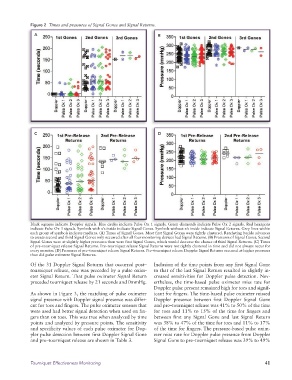
Figure 2  Times and pressures of Signal Gones and Signal Returns.
               A                                                  B


               C                                                  D


              Black squares indicate Doppler signals. Blue circles indicate Pulse Ox 1 signals. Green diamonds indicate Pulse Ox 2 signals. Red hexagons
              indicate Pulse Ox 3 signals. Symbols with �’s inside indicate Signal Gones. Symbols without �’s inside indicate Signal Returns. Grey lines within
              each group of symbols indicate medians. (A) Times of Signal Gones. Most first Signal Gones were tightly clustered. Ratcheting buckle advances
              to create second and third Signal Gones only occurred after all four monitoring devices had Signal Returns. (B) Pressures of Signal Gones. Second
              Signal Gones were at slightly higher pressures than were first Signal Gones, which would decrease the chance of third Signal Returns. (C) Times
              of pre–tourniquet release Signal Returns. Pre–tourniquet release Signal Returns were not tightly clustered in time and did not always occur for
              every monitor. (D) Pressures of pre–tourniquet release Signal Returns. Pre–tourniquet release Doppler Signal Returns occurred at higher pressures
              than did pulse oximeter Signal Returns.
              Of the 31 Doppler Signal Returns that occurred post–  Inclusion of the time points from any first Signal Gone
              tourniquet release, one was preceded by a pulse oxim-  to that of the last Signal Return resulted in slightly in-
              eter Signal Return. That pulse oximeter Signal Return   creased sensitivities for Doppler pulse detection. Nev-
              preceded tourniquet release by 21 seconds and 0mmHg.  ertheless, the time-based pulse oximeter miss rate for
                                                                 Doppler pulse present remained high for toes and signif-
              As shown in Figure 3, the matching of pulse oximeter   icant for fingers. The time-based pulse oximeter missed
              signal presence with Doppler signal presence was differ-  Doppler  presence  between  first  Doppler  Signal  Gone
              ent for toes and fingers. The pulse oximeter sensors that   and pre–tourniquet release was 41% to 50% of the time
              were used had better signal detection when used on fin-  for toes and 11% to 15% of the time for fingers and
              gers than on toes. This was true when analyzed by time   between first any Signal Gone and last Signal Return
              points and analyzed by pressure points. The sensitivity   was 38% to 47% of the time for toes and 11% to 17%
              and specificity values of each pulse oximeter for Dop-  of the time for fingers. The pressure-based pulse oxim-
              pler pulse detection between first Doppler Signal Gone   eter miss rate for Doppler pulse presence from Doppler
              and pre–tourniquet release are shown in Table 3.   Signal Gone to pre–tourniquet release was 39% to 49%


              Tourniquet Effectiveness Monitoring                                                             41