
Page 36 - Journal of Special Operations Medicine - Winter 2016
P. 36
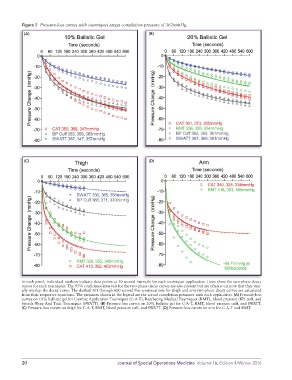
Figure 2  Pressure-loss curves with tourniquet target completion-pressure of 362mmHg.
           (A)                                                (B)


           (C)                                                (D)


          In each panel, individual markers indicate data points at 30 second intervals for each tourniquet application. Lines show the two-phase decay
          curves for each tourniquet. The 95% confidence intervals for the two-phase decay curves are also present but are often so narrow that they visu-
          ally overlap the decay curve. The dashed 301 through 600 second line continuations for thigh and arm two-phase decay curves are calculated
          from their respective equations. The pressures shown in the legend are the actual completion-pressures with each application. (A) Pressure-loss
          curves on 10% ballistic gel for Combat Application Tourniquet (C-A-T), Ratcheting Medical Tourniquet (RMT), blood pressure (BP) cuff, and
          Stretch Wrap And Tuck-Tourniquet (SWATT). (B) Pressure-loss curves on 20% ballistic gel for C-A-T, RMT, blood pressure cuff, and SWATT.
          (C) Pressure-loss curves on thigh for C-A-T, RMT, blood pressure cuff, and SWATT. (D) Pressure-loss curves on arm for C-A-T and RMT.


          20                                     Journal of Special Operations Medicine  Volume 16, Edition 4/Winter 2016