
Page 34 - Journal of Special Operations Medicine - Winter 2014
P. 34
the arm ranged from 0.11 to 0.54. These r values indi- Minute; Ladder pressures were higher than Strap pres-
2
cate a weak relationship between Friction pressure and sures 87 out of 96 times. Exceptions occurred with the
ratchet buckle travel needed for Completion. Old Tactical (1 occurrence), Old Mass Casualty (2 occur-
rences), and New Mass Casualty RMTs (6 occurrences).
Despite the narrower ladder on the Tactical RMT, pres-
sures measured under the comparable locations were With the Flexible Mass Casualty RMT, Ladder and
not significantly different for the two RMT designs at Strap pressures at Occlusion, Completion, and 1 Minute
each time point (Figure 1). In fact, Tactical RMT pres- were also different from each other. This difference also
sures were often lower than Mass Casualty pressures at increased at greater pressures. However, the frequency
Occlusion, Completion, and 1 Minute (Figure 1). with which the Ladder pressure was higher than Strap
pressure changed to 15 out of 32 applications. This
Since the comparable location Tactical and Mass Ca- change in ratio is statistically different from what was
sualty RMT pressures were not statistically different, seen before (p = .0004 versus Old and New Mass Ca-
hereafter, Tactical and Mass Casualty RMT pressures sualty RMT ratio and p = .0319 versus only New Mass
were combined for comparable locations. Regarding Casualty RMT ratio). The change in relationship indi-
limb locations, thigh pressure values were higher than cates that users cannot assume that measurements under
arm pressure values and were never combined. any single portion of a strap-based tourniquet are the
highest pressures under that tourniquet.
Ladder and Strap Differences
Contrary to our hypothesis, pressures under the ladder RMTs Versus CAT
and strap were not equivalent. Pressure under the Lad- RMT pressures and previously reported CAT pressures
der tended to be higher than pressure under the Strap are shown in Figure 3. Both RMT and CAT designs
(Figure 2). The Ladder versus Strap difference increased involve a 3.8cm-wide strap. Both designs have simi-
at greater pressures. At Occlusion, Completion, and 1 lar initial Friction pressure ranges. Both designs have
concerning pressures, greater than 300mmHg, from
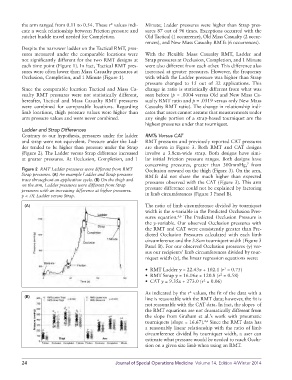
7
Figure 2 RMT Ladder pressures were different from RMT Occlusion onward on the thigh (Figure 3). On the arm,
Strap pressures. (A) An example Ladder and Strap pressure RMTs did not share the much higher than expected
trace throughout an application cycle. (B) On the thigh and pressures observed with the CAT (Figure 3). This arm
on the arm, Ladder pressures were different from Strap
pressures with an increasing difference at higher pressures. pressure difference could not be explained by factoring
p < .01 Ladder versus Strap. in limb circumferences (Figure 3 Panel B).
(A) The ratio of limb circumference divided by tourniquet
width is the x-variable in the Predicted Occlusion Pres-
sures equation. The Predicted Occlusion Pressure is
4,6
the y-variable. Our observed Occlusion pressures with
the RMT and CAT were consistently greater than Pre-
dicted Occlusion Pressures calculated with each limb
circumference and the 3.8cm tourniquet width (Figure 3
Panel B). For our observed Occlusion pressures (y) ver-
sus our recipients’ limb circumferences divided by tour-
niquet width (x), the linear regression equations were:
• RMT Ladder y = 22.43x + 102.1 (r = 0.75)
2
• RMT Strap y = 16.06x + 120.8 (r = 0.58)
2
• CAT y = 9.35x + 273.0 (r = 0.06)
2
As indicated by the r values, the fit of the data with a
2
(B) line is reasonable with the RMT data; however, the fit is
not reasonable with the CAT data. In fact, the slopes of
the RMT equations are not dramatically different from
the slope from Graham et al.’s work with pneumatic
tourniquets (slope = 16.67). Since the RMT data has
4,6
a reasonably linear relationship with the ratio of limb
circumference divided by tourniquet width, a user can
estimate what pressure would be needed to reach Occlu-
sion on a given size limb when using an RMT.
24 Journal of Special Operations Medicine Volume 14, Edition 4/Winter 2014