
Page 33 - Journal of Special Operations Medicine - Winter 2014
P. 33
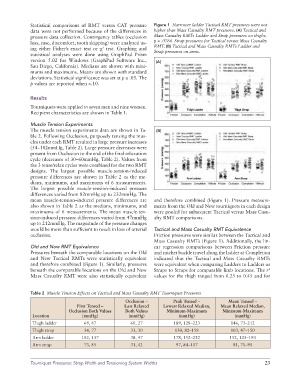
Statistical comparisons of RMT versus CAT pressure   Figure 1  Narrower ladder Tactical RMT pressures were not
              data were not performed because of the differences in   higher than Mass Casualty RMT pressures. (A) Tactical and
              pressure data collection. Contingency tables (occlusion   Mass Casualty RMTs Ladder and Strap pressures on thighs,
              loss, ease, discomfort, tooth skipping) were analyzed us-  p = .0766. Strap pressures for Tactical versus Mass Casualty
              ing either  Fisher’s exact  test  or  χ  test.  Graphing and   RMT. (B) Tactical and Mass Casualty RMTs Ladder and
                                           2
                                                                 Strap pressures on arms.
              statistical analyses were done using GraphPad Prism
              version 5.02 for Windows (GraphPad Software Inc.,   (A)
              San Diego, California). Medians are shown with mini-
              mums and maximums. Means are shown with standard
              deviations. Statistical significance was set at p ≤ .05. The
              p values are reported when <.10.


              Results
              Tourniquets were applied to seven men and nine women.
              Recipient characteristics are shown in Table 1.

              Muscle Tension Experiments
              The muscle tension experiments data are shown in Ta-  (B)
              ble 2. Following Occlusion, purposely tensing the mus-
              cles under each RMT resulted in large pressure increases
              (54–182mmHg, Table 2). Large pressure decreases were
              present from Occlusion to the end of the final relaxation
              cycle (decreases of 30–60mmHg, Table 2). Values from
              the 3 tense/relax cycles were combined for the two RMT
              designs.  The largest  possible muscle-tension-induced
              pres sure differences are shown in Table 2 as the me-
              dians, minimums, and maximums of 6 measurements.
              The largest possible muscle-tension–induced pressure
                differences varied from 82mmHg up to 232mmHg. The
              mean muscle-tension–induced pressure differences are   and therefore combined (Figure 1). Pressure measure-
              also shown in Table 2 as the medians, minimums, and   ments from the Old and New tourniquets in each design
              maximums of 6 measurements. The mean muscle-ten-   were pooled for subsequent Tactical versus Mass Casu-
              sion–induced pressure differences varied from 47mmHg   alty RMT comparisons.
              up to 212mmHg. The magnitude of the pressure changes
              would be more than sufficient to result in loss of arterial   Tactical and Mass Casualty RMT Equivalence
              occlusion.                                         Friction pressures were similar between the Tactical and
                                                                 Mass Casualty RMTs (Figure 1). Additionally, the lin-
              Old and New RMT Equivalence                        ear regression comparisons between Friction pressure
              Pressures beneath the comparable locations on the Old   and ratchet buckle travel along the ladder at Completion
              and New Tactical RMTs were statistically equivalent   indicated that the Tactical and Mass Casualty RMTs
              and therefore combined (Figure 1). Similarly, pressures   were equivalent when comparing Ladders to Ladders or
              beneath the comparable locations on the Old and New   Straps to Straps for comparable limb locations. The r
                                                                                                                2
              Mass Casualty RMT were also statistically equivalent   values for the thigh ranged from 0.25 to 0.45 and for


              Table 2  Muscle Tension Effects on Tactical and Mass Casualty RMT Tourniquet Pressures
                                                     Occlusion –         Peak Tensed –         Mean Tensed –
                                 First Tensed –     Last Relaxed    Lowest Relaxed Median,   Mean Relaxed Median,
                             Occlusion Both Values    Both Values     Minimum-Maximum        Minimum-Maximum
              Location             (mmHg)             (mmHg)               (mmHg)                 (mmHg)
              Thigh ladder          69, 87             60, 27            189, 128–223           146, 73–212
              Thigh strap           54, 77             33, 30            130, 82–158            103, 47–150
              Arm ladder           182, 137            38, 47            178, 152–232           152, 125–193
              Arm strap             73, 85             31, 42             97, 84–107             81, 71–95


              Tourniquet Pressures: Strap Width and Tensioning System Widths                                  23