
Page 74 - Journal of Special Operations Medicine - Fall 2014
P. 74
the RMN while sleeping for 7 consecutive nights. When Significant differences may be examined according to a
these 7 nights were completed, participants were asked nonparametric test, such as the Wilcoxon signed-rank
to report their experiences for the previous 5 nights of test used here, and central tendencies may be expressed
sleep, allowing 2 nights to acclimate to the sensations as medians.
of sleeping with the device in their mouth. These scores
were designated as B1.
Results
Participants were then asked to refrain from using the Total scores, which incorporate frequency and intensity
device for the next 7 nights and to report the experi- from all three symptoms, were relatively high at baseline
–
ences of all 7. These scores were designated as A2. Each (x = 0.53). Total scores from the B1 phase were signifi-
–
was then asked to resume the use of the device for an- cantly lower (x = 0.21), z = –2.53, p = .0001. Those from
–
other 7 nights and, when completed, to report their ex- the B2 phase were likewise lower (x = 0.34), z = –2.94,
periences for the last 5. These scores were designated as p = .0001. Scores from each survey dimension, which
B2. When participants were instructed to use the device incorporate frequency and intensity for one symptom,
while sleeping, they were also instructed to use the de- were lower during the B1 and B2 phases than during the
vice any time they napped during the day. A1 and A2 phases (Table 1).
All survey dimensions show significant reductions in re-
Measures
ports of symptoms. Scores from B1 were significantly
The present study measured the frequency and inten- lower than baseline scores for HAs (z = -2.80, p = .005),
sity of three dimensions of PTSD sleep symptoms (HAs, for NMs (z = –2.01, p = .04), and for SDs (z = –2.93,
NMs, and SDs) by self-report, according to two forms p = .003). Scores from B2 were likewise lower for HAs
of an equivalent forms reliable survey referred to as (z = –2.13, p = .03), NMs (z = –2.60, p = .001), and SDs
the PTSD Night Symptoms Index (PNSI). The PNSI-7 (z = –2.93, p = .003). The mean scores for both A1 and A2
(a 7-day version of the survey, included as Appendix A) phases for each category maintained exceptional similarity
was administered during the baseline and control phases that indicates no impact on the results due to maturation.
(A1 and A2). The PNSI-5 (a 5-day version of the survey,
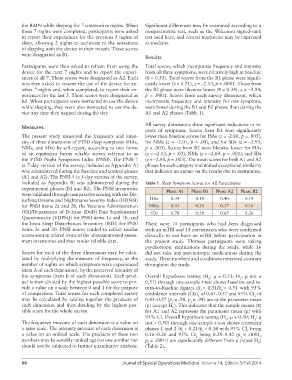
included as Appendix B) was administered during the Table 1 Sleep Symptom Scores for All Participants
experimental phases (B1 and B2). The PNSI inventories Phase A1 Phase B1 Phase A2 Phase B2
were validated through comparative scoring with the Dis-
turbing Dreams and Nightmares Severity Index (DDNSI) HAs 0.39 0.19 0.40 0.19
for PNSI items 2a and 2b, the Veterans Administration NMs 0.43 0.20 0.37 0.16
(VA)/Department of Defense (DoD) Pain Supplemental SDs 0.78 0.28 0.65 0.26
Questionnaire (VDPSQ) for PNSI items 1a and 1b, and
the Iowa Sleep Disturbances Inventory (ISDI) for PNSI There were 14 participants who had been diagnosed
items 3a and 3b. PNSI scores tended to reflect similar with an mTBI and 15 participants who were confirmed
scores seen in related items of the aforementioned assess- clinically to not have an mTBI before participation in
ment inventories and thus render reliable data. the present study. Thirteen participants were taking
psychotropic medications during the study, while 16
Scores for each of the three dimensions may be calcu- did not take any psychotropic medications during the
lated by multiplying the measure of frequency, as the study. These numbers and conditions remained constant
number of nights on which symptoms were experienced throughout the study.
(item A of each dimension), by the perceived intensity of
the symptoms (item B of each dimension). Each prod- Overall hypothesis testing (H : μ = 0.51; H : μ not =
1
0
uct is then divided by the highest possible score to pro- 0.51) through one-sample t-test shows baseline and re-
–
–
vide a value on a scale between 0 and 1 for the purpose turn-to-baseline figures (x = 0.51/x = 0.51 with 95%
1
2
of comparison. Total scores for each completed survey confidence intervals (CIs) of 0.45–0.57 and 95% CI of
1
2
may be calculated by adding together the products of 0.45–0.57 (p = .98, p = .94) are at the parameter mean
2
1
–
each dimension and then dividing by the highest pos- (μ) (accept H ). This indicates that the sample means (x)
0
sible score for the whole survey. for A1 and A2 represent the parameter mean (μ) with
95% CI. Overall hypothesis testing (H : μ = 0.50; H : μ
0
1
The frequency measure of each dimension is a value on not = 0.50) through one-sample t-test shows treatment
–
–
a ratio scale. The intensity measure of each dimension is phases 1 and 2 (x = 0.21/x = 0.34 with 95% CI being
1
2
1
a value on an ordinal scale. The products of these two 0.16–0.26 and 95% CI being 0.28–0.42 (p = .0001,
2
1
numbers may be sensibly ranked against one another but p = .0001) are significantly different from μ (reject H )
2
0
should not be subjected to further quantitative analysis. (Table 2).
66 Journal of Special Operations Medicine Volume 14, Edition 3/Fall 2014