
Page 75 - Journal of Special Operations Medicine - Fall 2014
P. 75
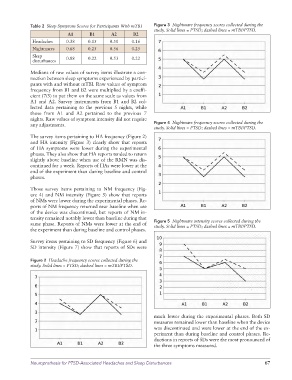
Table 2  Sleep Symptom Scores for Participants With mTBI  Figure 3  Nightmare frequency scores collected during the
                                                                 study. Solid lines = PTSD; dashed lines = mTBI/PTSD.
                             A1       B1       A2       B2
              Headaches     0.38     0.15     0.50     0.16
              Nightmares    0.68     0.25     0.56     0.25
              Sleep         0.88     0.22     0.53     0.22
              disturbances

              Medians of raw values of survey items illustrate a con-
              nection between sleep symptoms experienced by partici-
              pants with and without mTBI. Raw values of symptom
              frequency from B1 and B2 were multiplied by a coeffi-
              cient (7/5) to put them on the same scale as values from
              A1 and A2. Survey instruments from B1 and B2 col-
              lected data pertaining to the previous 5 nights, while
              those from A1 and A2 pertained to the previous 7
              nights. Raw values of symptom intensity did not require
              any adjustments.                                   Figure 4  Nightmare frequency scores collected during the
                                                                 study. Solid lines = PTSD; dashed lines = mTBI/PTSD.
              The survey items pertaining to HA frequency (Figure 2)
              and HA intensity (Figure 3) clearly show that reports
              of HA symptoms were lower during the experimental
              phases. They also show that HA reports tended to return
              slightly above baseline when use of the RMN was dis-
              continued for a week. Reports of HAs were lower at the
              end of the experiment than during baseline and control
              phases.

              Those survey items pertaining to NM frequency (Fig-
              ure 4) and NM intensity (Figure 5) show that reports
              of NMs were lower during the experimental phases. Re-
              ports of NM frequency returned near baseline when use
              of the device was discontinued, but reports of NM in-
              tensity remained notably lower than baseline during that   Figure 5  Nightmare intensity scores collected during the
              same phase. Reports of NMs were lower at the end of   study. Solid lines = PTSD; dashed lines = mTBI/PTSD.
              the experiment than during baseline and control phases.

              Survey items pertaining to SD frequency (Figure 6) and
              SD intensity (Figure 7) show that reports of SDs were

              Figure 2  Headache frequency scores collected during the
              study. Solid lines = PTSD; dashed lines = mTBI/PTSD.


                                                                 much lower during the experimental phases. Both SD
                                                                 measures remained lower than baseline when the device
                                                                 was discontinued and were lower at the end of the ex-
                                                                 periment than during baseline and control phases. Re-
                                                                 ductions in reports of SDs were the most pronounced of
                                                                 the three symptoms measured.


              Neuroprothesis for PTSD-Associated Headaches and Sleep Disturbances                             67