


Page 29 - JSOM Winter 2025
P. 29
Methods                                            TABLE 1  Study Variables Included in the Analysis with Description
                                                                 and Abbreviations
              A retrospective  chart review was conducted with the ap-
              proval of the University of  Alberta Research Ethics Office   Variable                   Abbreviation
              (Pro00088974). STROBE reporting guidelines were followed.    Primary outcome
                                                             7
              The study used Shock Trauma Air Rescue Society (STARS)   First measured fibrinogen level in the ED*
              Electronic Patient Care Reports (ePCR), and records from the   Secondary outcomes
              University of Alberta Hospital (UAH), the Royal Alexandra   First INR measured in the ED †  INR-ED
              Hospital (RAH) (level one and two trauma centers respectively)   Massive hemorrhage protocol activation in the ED  MHP-ED
              in Edmonton, Alberta, and data from the Alberta Trauma Reg-  Need for surgery and/or angiography  Surg/angio
              istry. The study period was January 2015 to August 2019. We
              enrolled consecutive patients of any age over the weight of   Discharge status (alive or dead)  Discharge
              50kg with blunt or penetrating trauma and transported by   Mortality within 14 days of injury from   Mortality14
                                                                 hemorrhage/multiorgan failure
              STARS who received at least one unit of packed red blood cells
              (pRBC) by STARS. In total, we collected data from 65 trauma   Primary predictors
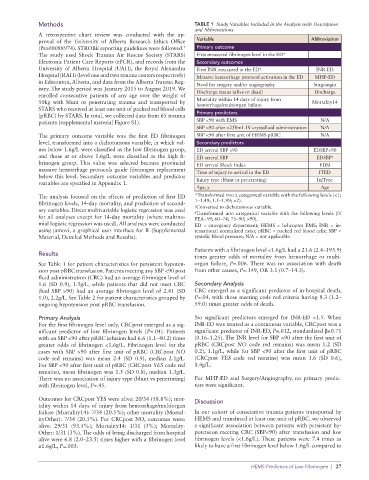
              patients (supplemental material Figure S1).        SBP <90 with EMS                         N/A
                                                                 SBP <90 after >250mL IV crystalloid administration  N/A
              The primary outcome variable was the first ED fibrinogen   SBP <90 after first unit of HEMS pRBC  N/A
              level, transformed into a dichotomous variable, in which val-  Secondary predictors
              ues below 1.6g/L were classified as the low fibrinogen group,   ED arrival SBP <90       EDSBP<90
              and those at or above 1.6g/L were classified as the high fi-  ED arrival SBP              EDSBP ‡
              brinogen group. This value was selected because provincial   ED arrival Shock Index        EDSI
              massive hemorrhage protocols guide fibrinogen replacement   Time of injury to arrival in the ED  ITED
              below this level. Secondary outcome variables and predictor
              variables are specified in Appendix 1.             Injury type (blunt or penetrating)      InjType
                                                                 Age, y                                   Age
              The analysis focused on the effects of prediction of first ED   *Transformed into a categorical variable with the following levels (<1;
              fibrinogen levels, 14-day mortality, and prediction of second-  1–1.49; 1.5–1.99; >2).
                                                                 †
              ary variables. Direct multivariable logistic regression was used   ‡ Converted to dichotomous variable.
                                                                 Transformed into categorical variable with the following levels (0/
              for all analyses except for 14-day mortality (where multino-  PEA–59; 60–74; 75–90; >90).
              mial logistic regression was used). All analyses were conducted   ED = emergency department; HEMS = helicopter EMS; INR = in-
              using jamovi, a graphical user interface for R (Supplemental   ternational normalized ratio; pRBC = packed red blood cells; SBP =
              Material, Detailed Methods and Results).           systolic blood pressure; N/A = not applicable.
                                                                 Patients with a fibrinogen level <1.6g/L had a 21.6 (2.4–193.9)
              Results
                                                                 times greater odds of mortality from hemorrhage or multi-
              See Table 1 for patient characteristics for persistent hypoten-  organ failure,  P=.006. There was no association with death
              sion post pRBC transfusion. Patients meeting any SBP <90 post   from other causes, P=.149, OR 3.1 (0.7–14.3).
              fluid administration (CRC) had an average fibrinogen level of
              1.6 (SD 0.9), 1.5g/L, while patients that did not meet CRC   Secondary Analysis
              (had SBP >90) had an average fibrinogen level of 2.41 (SD   CRC emerged as a significant predictor of in-hospital death,
              1.0), 2.2g/L. See Table 2 for patient characteristics grouped by   P=.04, with those meeting code red criteria having 8.3 (1.2–
              ongoing hypotension post pRBC transfusion.         59.0) times greater odds of death.

              Primary Analysis                                   No significant predictors emerged for INR-ED >1.5.  When
              For the first fibrinogen level only, CRCpost emerged as a sig-  INR-ED was treated as a continuous variable, CRCpost was a
              nificant predictor of low fibrinogen levels (P=.04). Patients   significant predictor of INR-ED, P=.012, standardized β=0.71
              with an SBP <90 after pRBC infusion had 6.6 (1.1–40.2) times   (0.16–1.25). The INR level for SBP >90 after the first unit of
              greater odds of fibrinogen <1.6g/L. Fibrinogen level for the   pRBC  (CRCpost  NO code  red  remains)  was mean  1.2  (SD
              cases with  SBP  >90 after first  unit of pRBC (CRCpost NO   0.2), 1.1g/L, while for SBP <90 after the first unit of pRBC
              code red remains) was mean 2.4 (SD 0.9), median 2.1g/L.   (CRCpost  YES code red remains) was mean 1.6 (SD 0.6),
              For SBP <90 after first unit of pRBC (CRCpost YES code red   1.4g/L.
              remains), mean fibrinogen was 1.5 (SD 0.8), median 1.3g/L.
              There was no association of injury type (blunt vs penetrating)   For MHP-ED and Surgery/Angiography, no primary predic-
              with fibrinogen level, P=.45.                      tors were significant.

              Outcomes for CRCpost YES were alive: 20/34 (58.8%); mor-  Discussion
              tality within 14 days of injury from hemorrhage/multiorgan
              failure (Mortality14): 7/34 (20.5%); other mortality (Mortal-  In our cohort of consecutive trauma patients transported by
              ityOther): 7/34 (20.5%). For CRCpost NO, outcomes were:   HEMS and transfused at least one unit of pRBC, we observed
              alive: 29/31 (93.5%); Mortality14: 1/31 (3%); Mortality-  a significant association between patients with persistent hy-
              Other: 1/31 (3%). The odds of being discharged from hospital   potension meeting CRC (SBP<90) after transfusion and low
              alive were 6.8 (2.0–23.5) times higher with a fibrinogen level   fibrinogen levels (<1.6g/L). These patients were 7.4 times as
              ≥1.6g/L, P=.003.                                   likely to have a first fibrinogen level below 1.6g/L compared to


                                                                                   HEMS Predictors of Low Fibrinogen  |  27

