


Page 30 - JSOM Winter 2025
P. 30
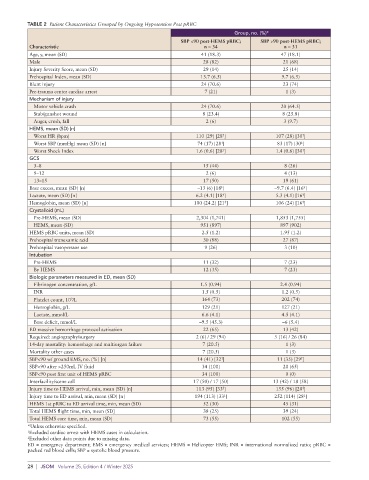
TABLE 2  Patient Characteristics Grouped by Ongoing Hypotension Post pRBC
                                                                              Group, no. (%)*
                                                            SBP <90 post-HEMS pRBC;    SBP >90 post-HEMS pRBC;
           Characteristic                                           n = 34                    n = 31
           Age, y, mean (SD)                                       41 (18.3)                 47 (18.1)
           Male                                                    28 (82)                   21 (68)
           Injury Severity Score, mean (SD)                        29 (14)                   25 (14)
           Prehospital Index, mean (SD)                            13.7 (6.5)                9.7 (6.5)
           Blunt injury                                            24 (70.6)                 23 (74)
           Pre-trauma center cardiac arrest                         7 (21)                    1 (3)
           Mechanism of injury
            Motor vehicle crash                                    24 (70.6)                 20 (64.5)
            Stab/gunshot wound                                     8 (23.4)                  8 (25.8)
            Auger, crush, fall                                      2 (6)                     3 (9.7)
           HEMS, mean (SD) [n]
            Worst HR (bpm)                                       110 (29) [28 ]            107 (28) [30 ]
                                                                          †
                                                                                                    †
            Worst SBP (mmHg) mean (SD) [n]                        74 (17) [28 ]             83 (17) [30 ]
                                                                         †
                                                                                                   ‡
            Worst Shock Index                                    1.6 (0.6) [28 ]           1.4 (0.6) [30 ]
                                                                          †
                                                                                                    †
           GCS
            3–8                                                    15 (44)                    8 (26)
            9–12                                                    2 (6)                     4 (13)
            13–15                                                  17 (50)                   19 (61)
           Base excess, mean (SD) [n]                             –13 (6) [18 ]            –9.7 (6.4) [16 ]
                                                                         ‡
                                                                                                    ‡
                                                                                                    ‡
           Lactate, mean (SD) [n]                                6.2 (4.1) [18 ]           5.3 (4.1) [16 ]
                                                                          ‡
                                                                                                    ‡
           Hemoglobin, mean (SD) [n]                            100 (24.2) [21 ]           106 (24) [16 ]
                                                                          ‡
           Crystalloid (mL)
            Pre-HEMS, mean (SD)                                  2,304 (1,741)             1,853 (1,755)
            HEMS, mean (SD)                                        951 (897)                 897 (902)
           HEMS pRBC units, mean (SD)                              2.5 (1.2)                 1.95 (1.2)
           Prehospital tranexamic acid                             30 (88)                   27 (87)
           Prehospital vasopressor use                              9 (26)                    3 (10)
           Intubation
            Pre-HEMS                                               11 (32)                    7 (23)
            By HEMS                                                12 (35)                    7 (23)
           Biologic parameters measured in ED, mean (SD)
            Fibrinogen concentration, g/L                          1.5 (0.94)                2.4 (0.94)
            INR                                                    1.5 (0.5)                 1.2 (0.5)
            Platelet count, 10 /L                                  164 (73)                  202 (74)
                        9
            Hemoglobin, g/L                                        129 (21)                  127 (21)
            Lactate, mmol/L                                        6.6 (4.1)                 4.5 (4.1)
            Base deficit, mmol/L                                  –9.5 (45.3)                –6 (5.4)
           ED massive hemorrhage protocol activation               22 (65)                   13 (42)
           Required: angiography/surgery                         2 (6) / 29 (94)           5 (16) / 26 (84)
           14-day mortality: hemorrhage and multiorgan failure     7 (20.5)                   1 (3)
           Mortality other cases                                   7 (20.5)                   1 (3)
                                                                         ‡
           SBP<90 w/ ground EMS, no. (%) [n]                      14 (41) [32 ]             11 (35) [29 ]
                                                                                                   ‡
           SBP<90 after >250mL IV fluid                            34 (100)                  20 (65)
           SBP<90 post first unit of HEMS pRBC                     34 (100)                   0 (0)
           Interfacility/scene call                             17 (50) / 17 (50)         13 (42) / 18 (58)
           Injury time to HEMS arrival, min, mean (SD) [n]       113 (95) [33 ]            155 (96) [28 ]
                                                                          ‡
                                                                                                    ‡
           Injury time to ED arrival, min, mean (SD) [n]         194 (113) [33 ]           252 (114) [28 ]
                                                                                                    ‡
                                                                          ‡
           HEMS 1st pRBC to ED arrival time, min, mean (SD)        52 (30)                   45 (31)
           Total HEMS flight time, min, mean (SD]                  38 (25)                   39 (24)
           Total HEMS care time, min, mean (SD]                    73 (55)                   102 (55)
          *Unless otherwise specified.
          † Excluded cardiac arrest with HEMS cases in calculation.
          ‡ Excluded other data points due to missing data.
          ED = emergency department; EMS = emergency medical services; HEMS = Helicopter EMS; INR = international normalized ratio; pRBC =
          packed red blood cells; SBP = systolic blood pressure.
          28  |  JSOM   Volume 25, Edition 4 / Winter 2025

