
Page 21 - JSOM Spring 2025
P. 21
breathing, to coughing. In normal breathing, expiratory pres- Effect of Design on Dependent Variables
sures range from 4.1cmH O for normal, at-rest breathing to To determine which design characteristics affect fluid flow
2
13
60–120cmH O at maximum expiratory capacity. To create and channel saturation, a multiple linear regression model was
2
fluid flow through the chest seals at different pressures, the used to test for the effects of channel width and number of
chest seals were adhered to a stiff, closed-cell foam to simulate channels (Tables 1 and 2) on the results for all novel chest
adhesion to a human chest. A small hole was cut in the middle seals. To control for the effect of the initial pressure on flow
of the foam to model an open chest wound. Vinyl tubing with rate and channel saturation, the initial pressure was included
an inner diameter of 7.9mm was attached to the opening in as an independent variable along with channel width and
the foam. The tubing extended vertically and could be filled quantity. Correlations were considered significant at p<.05.
with fluid to varying pressure heads. Water was chosen as the
fluid to simulate blood flow, owing to accessibility and repro- Results
ducibility. While it has been found that the densities of water
and blood are similar (around 1g/cm with slight variations in Flow Rate
3
14
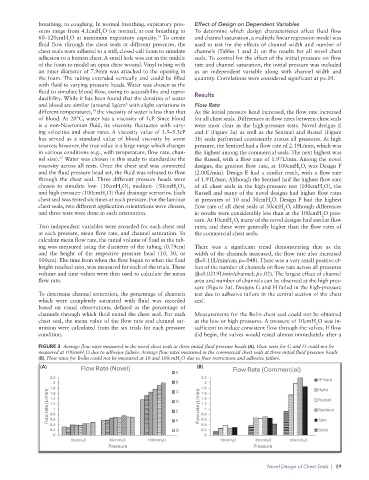
different temperature), the viscosity of water is less than that As the initial pressure head increased, the flow rate increased
of blood. At 20°C, water has a viscosity of 1cP. Since blood for all chest seals. Differences in flow rates between chest seals
is a non-Newtonian fluid, its viscosity fluctuates with vary- were most clear in the high-pressure tests. Novel designs E
ing velocities and shear rates. A viscosity value of 3.5–5.5cP and F (Figure 3a) as well as the Sentinel and Russel (Figure
has served as a standard value of blood viscosity by some 3b) seals performed consistently across all pressures. At high
sources; however, the true value is a large range which changes pressure, the Sentinel had a flow rate of 2.19L/min, which was
in various conditions (e.g., with temperature, flow rate, chan- the highest among the commercial seals. The next highest was
nel size). Water was chosen in this study to standardize the the Russel, with a flow rate of 1.97L/min. Among the novel
15
viscosity across all tests. Once the chest seal was connected designs, the greatest flow rate, at 100cmH O, was Design F
2
and the fluid pressure head set, the fluid was released to flow (2.00L/min). Design E had a similar result, with a flow rate
through the chest seal. Three different pressure heads were of 1.91L/min. Although the Sentinel had the highest flow rate
chosen to simulate low- (10cmH O), medium- (30cmH O), of all chest seals in the high-pressure test (100cmH O), the
2
2
2
and high-pressure (100cmH O) fluid drainage scenarios. Each Russell and many of the novel designs had higher flow rates
2
chest seal was tested six times at each pressure. For the laminar at pressures of 10 and 30cmH O. Design F had the highest
2
chest seals, two different application orientations were chosen, flow rate of all chest seals at 30cmH O, although differences
2
and three tests were done in each orientation. in results were considerably less than at the 100cmH O pres-
2
sure. At 10cmH O, many of the novel designs had similar flow
2
Two independent variables were recorded for each chest seal rates, and these were generally higher than the flow rates of
at each pressure, mean flow rate, and channel saturation. To the commercial chest seals.
calculate mean flow rate, the initial volume of fluid in the tub-
ing was measured using the diameter of the tubing (0.79cm) There was a significant trend demonstrating that as the
and the height of the respective pressure head (10, 30, or width of the channels increased, the flow rate also increased
100cm). The time from when the flow began to when the fluid (β=0.11L/min/cm; p=.048). There was a very small positive ef-
height reached zero, was measured for each of the trials. These fect of the number of channels on flow rate across all pressures
volume and time values were then used to calculate the mean (β=0.0219L/min/channel; p=.02). The largest effect of channel
flow rate. area and number of channels can be observed at the high pres-
sure (Figure 3a). Designs G and H failed in the high-pressure
To determine channel saturation, the percentage of channels test due to adhesive failure in the central section of the chest
which were completely saturated with fluid was recorded seal.
based on visual observations, defined as the percentage of
channels through which fluid exited the chest seal. For each Measurements for the Bolin chest seal could not be obtained
chest seal, the mean value of the flow rate and channel sat- at the low or high pressures. A pressure of 10cmH O was in-
2
uration were calculated from the six trials for each pressure sufficient to induce consistent flow through the valves. If flow
condition. did begin, the valves would reseal almost immediately after a
FIGURE 3 Average flow rates measured in the novel chest seals at three initial fluid pressure heads (A). Flow rates for G and H could not be
measured at 100cmH O due to adhesive failure. Average flow rates measured in the commercial chest seals at three initial fluid pressure heads
2
(B). Flow rates for Bolin could not be measured at 10 and 100cmH O due to flow restrictions and adhesive failure.
2
(A)
(A) (B)
Novel Design of Chest Seals | 19