Page 125 - JSOM Winter 2024
P. 125

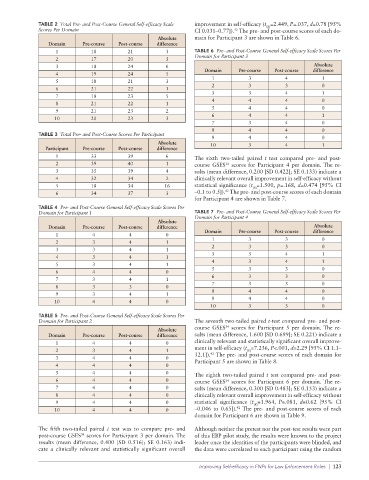
TABLE 2  Total Pre- and Post-Course General Self-efficacy Scale   improvement in self-efficacy (t =2.449, P=.037, d=0.78 [95%
                                                                                        (8)
              Scores Per Domain                                  CI 0.031–0.77]).  The pre- and post-course scores of each do-
                                                                              42
                                                     Absolute    main for Participant 3 are shown in Table 6.
                 Domain     Pre-course  Post-course   difference
                   1           18          21          3         TABLE 6  Pre- and Post-Course General Self-efficacy Scale Scores Per
                   2           17          20          3         Domain for Participant 3
                                                                                                        Absolute
                   3           18          24          6            Domain     Pre-course   Post-course   difference
                   4           19          24          5
                                                                      1           3           4           1
                   5           18          21          3
                                                                      2           3           3           0
                   6           21          22          1
                                                                      3           3           4           1
                   7           18          23          5
                   8           21          22          1              4           4           4           0
                   9           21          23          2              5           4           4           0
                   10          20          23          3              6           4           4           1
                                                                      7           3           4           0
                                                                      8           4           4           0
              TABLE 3  Total Pre- and Post-Course Scores Per Participant
                                                                      9           4           4           0
                                                     Absolute         10          3           4           1
                Participant  Pre-course   Post-course   difference
                   1           33          39          6         The sixth two-tailed paired  t test compared pre- and post-
                   2           39          40          1         course GSES  scores for Participant 4 per domain. The re-
                                                                           34
                   3           35          39          4         sults (mean difference, 0.200 [SD 0.422]; SE 0.133) indicate a
                   4           32          34          2         clinically relevant overall improvement in self-efficacy without
                   5           18          34          16        statistical significance (t =1.500, p=.168, d=0.474 [95% CI
                                                                                    (8)
                                                                           42
                   6           34          37          3         –0.1 to 0.5]).  The pre- and post-course scores of each domain
                                                                 for Participant 4 are shown in Table 7.
              TABLE 4  Pre- and Post-Course General Self-efficacy Scale Scores Per
              Domain for Participant 1                           TABLE 7  Pre- and Post-Course General Self-efficacy Scale Scores Per
                                                                 Domain for Participant 4
                                                     Absolute
                 Domain     Pre-course   Post-course   difference                                       Absolute
                   1           4           4           0            Domain     Pre-course   Post-course   difference
                   2           3           4           1              1           3           3           0
                   3           3           4           1              2           3           3           0
                   4           3           4           1              3           3           4           1
                   5           3           4           1              4           3           4           1
                                                                      5           3           3           0
                   6           4           4           0
                                                                      6           3           3           0
                   7           3           4           1
                                                                      7           3           3           0
                   8           3           3           0
                                                                      8           4           4           0
                   9           3           4           1
                   10          4           4           0              9           4           4           0
                                                                      10          3           3           0
              TABLE 5  Pre- and Post-Course General Self-efficacy Scale Scores Per
              Domain for Participant 2                           The seventh two-tailed paired t-test compared pre- and post-
                                                                           34
                                                     Absolute    course GSES  scores for Participant 5 per domain. The re-
                 Domain     Pre-course   Post-course   difference  sults (mean difference, 1.600 [SD 0.699]; SE 0.221) indicate a
                   1           4           4           0         clinically relevant and statistically significant overall improve-
                   2           3           4           1         ment in self-efficacy (t =7.236, P<.001, d=2.29 [95% CI 1.1–
                                                                                  (8)
                                                                 32.1]).  The pre- and post-course scores of each domain for
                                                                      42
                   3           4           4           0         Participant 5 are shown in Table 8.
                   4           4           4           0
                   5           4           4           0         The eighth two-tailed paired t test compared pre- and post-
                   6           4           4           0         course GSES  scores for Participant 6 per domain. The re-
                                                                           34
                   7           4           4           0         sults (mean difference, 0.300 [SD 0.483]; SE 0.153) indicate a
                   8           4           4           0         clinically relevant overall improvement in self-efficacy without
                   9           4           4           0         statistical significance (t =1.964,  P=.081,  d=0.62 [95% CI
                                                                                    (8)
                                                                              42
                   10          4           4           0         –0.046 to 0.65]).  The pre- and post-course scores of each
                                                                 domain for Participant 6 are shown in Table 9.
              The fifth two-tailed paired  t test was to compare pre- and   Although neither the pretest nor the post-test results were part
                           34
              post-course GSES  scores for Participant 3 per domain. The   of this EBP pilot study, the results were known to the project
              results (mean difference,  0.400 [SD  0.516]; SE 0.163) indi-  leader once the identities of the participants were blinded, and
              cate a clinically relevant and statistically significant overall   the data were correlated to each participant using the random

                                                                  Improving Self-efficacy in FNPs for Law Enforcement Roles  |  123
   120   121   122   123   124   125   126   127   128   129   130