Page 15 - JSOM Fall 2024
P. 15

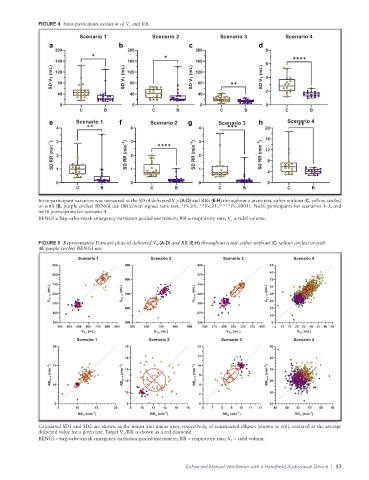
FIGURE 4  Intra-participant variation of V  and RR.
                                           T
                           Scenario 1              Scenario 2            Scenario 3           Scenario 4
                 a                      b                      c                      d
                   200                     200                   200                    8
                               ✱
                                                       ✱                                         ✱✱✱✱
                   160                     160                   160                    6
                  SD V T  (mL)  120       SD V T  (mL)  120     SD V T  (mL)  120  ✱✱  SD V T  (mL)  4
                                           80
                                                                  80
                    80
                    40                     40                     40                    2
                     0                      0                     0                     0
                           C       B               C       B             C       B            C       B
                 e        Scenario 1    f         Scenario 2  g         Scenario 3    h        Scenario 4
                   4         ✱✱             4                     4        ✱✱✱          20        ✱✱
                                                                                        16
                   3
                                            3
                                                                  3
                  SD RR (min -1 )  2      SD RR (min -1 )  2     SD RR (min -1 )  2   SD RR (min -1 )  12 8
                                                    ✱✱✱✱
                   1
                                                                  1
                                            1
                                                                                        4
                   0                        0                     0                     0
                          C       B               C       B             C       B              C       B
              Intra-participant variation was measured as the SD of delivered V s (A-D) and RRs (E-H) throughout a given test, either without (C, yellow circles)
                                                          T
              or with (B, purple circles) BENGI use (Wilcoxon signed rank test, *P<.05, **P<.01, ****P<.0001). N=20 participants for scenarios 1–3, and
              n=16 participants for scenario 4.
              BENGI = bag-valve-mask emergency narration guided instrument; RR = respiratory rate; V  = tidal volume.
                                                                            T


              FIGURE 5  Representative Poincaré plots of delivered V  (A-D) and RR (E-H) throughout a test, either without (C, yellow circles) or with
                                                    T
              (B, purple circles) BENGI use.
                           Scenario 1             Scenario 2              Scenario 3             Scenario 4
                  900                     900                    400                     45
                                                                                         40
                  800                                            375
                                          800                                            35
                  700                                            350                     30
                 V Tn+1  (mL)  600       V Tn+1  (mL)  700       V Tn+1  (mL)  325      V Tn+1  (mL)  25
                  500                                            300                     20
                                          600                                            15
                  400                                            275
                                                                                         10
                  300                     500                    250                      5
                    300  400  500  600  700  800  900  500  600  700  800  900  250  275  300  325  350  375  400  5  10  15  20  25  30  35  40  45
                            V Tn  (mL)             V Tn  (mL)              V Tn  (mL)             V Tn  (mL)
                          Scenario 1              Scenario 2             Scenario 3              Scenario 4
                  20                      18                     12                      90
                                                                 11
                                          16                     10                      80
                  15
                  RR n+1  (min -1 )      RR n+1  (min -1 )  14   RR n+1  (min -1 )  9   RR n+1  (min -1 )  70
                                                                                         60
                                          12
                  10
                                          10                      8 7                    50
                   5                      8                       6                      40
                    5     10    15    20   8   10  12  14  16  18  6  7  8  9  10  11  12  40  50  60  70  80  90
                                                       -1
                                                                               -1
                               -1
                                                                                                      -1
                          RR n  (min )            RR n  (min )            RR n  (min )           RR n  (min )
              Calculated SD1 and SD2 are shown as the minor and major axes, respectively, of constructed ellipses (shown in red), centered at the average
              delivered value for a given test. Target V /RR is shown as a red diamond.
                                         T
              BENGI = bag-valve-mask emergency narration guided instrument; RR = respiratory rate; V  = tidal volume.
                                                                            T
                                                              Enhanced Manual Ventilation with a Handheld Audiovisual Device  |  13
   10   11   12   13   14   15   16   17   18   19   20