
Page 13 - JSOM Fall 2024
P. 13
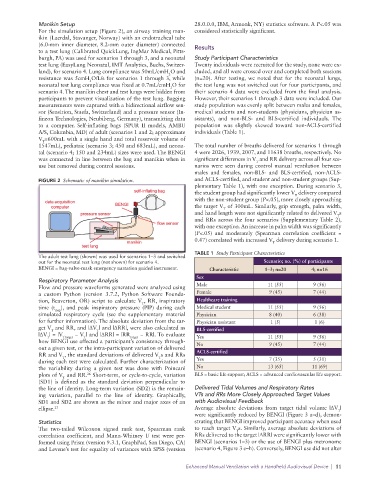
Manikin Setup                                      28.0.0.0, IBM, Armonk, NY) statistics software. A P<.05 was
              For the simulation setup (Figure 2), an airway training man-  considered statistically significant.
              ikin (Laerdal, Stavanger, Norway) with an endotracheal tube
              (6.0-mm inner diameter, 8.2-mm outer diameter) connected   Results
              to a test lung (Calibrated QuickLung, IngMar Medical, Pitts-
              burgh, PA) was used for scenarios 1 through 3, and a neonatal   Study Participant Characteristics
              test lung (EasyLung Neonatal, IMT Analytics, Buchs, Switzer-  Twenty individuals were recruited for the study, none were ex-
              land), for scenario 4. Lung compliance was 50mL/cmH O and   cluded, and all were crossed over and completed both sessions
                                                        2
              resistance was 5cmH O/L/s for scenarios 1 through 3, while   (n=20). After testing, we noted that for the neonatal lungs,
                              2
              neonatal test lung compliance was fixed at 0.7mL/cmH O for   the test lung was not switched out for four participants, and
                                                         2
              scenario 4. The manikin chest and test lungs were hidden from   their scenario 4 data were excluded from the final analysis.
              participants to prevent visualization of the test lung. Bagging   However, their scenarios 1 through 3 data were included. Our
              measurements were captured with a bidirectional airflow sen-  study population was evenly split between males and females,
              sor (Sensirion, Staefa, Switzerland) and a pressure sensor (In-  medical students and non-students (physicians, physician as-
              fineon Technologies, Neubiberg, Germany), transmitting data   sistants), and non-BLS- and BLS-certified individuals.  The
              to a computer. Self-inflating bags (SPUR II models,  AMBU   population was slightly skewed toward non-ACLS-certified
              A/S, Columbia, MD) of adult (scenarios 1 and 2; approximate   individuals (Table 1).
              V =600mL with a single hand and total reservoir volume of
               T
              1547mL), pediatric (scenario 3; 450 and 683mL), and neona-  The total number of breaths delivered for scenarios 1 through
              tal (scenario 4; 150 and 234mL) sizes were used. The BENGI   4 were 2026, 1939, 2007, and 11638 breaths, respectively. No
              was connected in line between the bag and manikin when in   significant differences in V  and RR delivery across all four sce-
                                                                                     T
              use but removed during control sessions.           narios were seen during control manual ventilation between
                                                                 males and females, non-BLS- and BLS-certified, non-ACLS-
              FIGURE 2  Schematic of manikin simulation.         and ACLS-certified, and student and non-student groups (Sup-
                                                                 plementary Table 1), with one exception. During scenario 3,
                                                                 the student group had significantly lower V  delivery compared
                                                                                                 T
                                                                 with the non-student group (P<.05), more closely approaching
                                                                 the target V  of 300mL. Similarly, grip strength, palm width,
                                                                          T
                                                                 and hand length were not significantly related to delivered V s
                                                                                                               T
                                                                 and  RRs  across  the  four  scenarios  (Supplementary Table  2),
                                                                 with one exception. An increase in palm width was significantly
                                                                 (P<.05) and moderately (Spearman correlation coefficient =
                                                                 0.47) correlated with increased V  delivery during scenario 1.
                                                                                          T
                                                                 TABLE 1  Study Participant Characteristics
              The adult test lung (shown) was used for scenarios 1–3 and switched
              out for the neonatal test lung (not shown) for scenario 4.               Scenario; no. (%) of participants
              BENGI = bag-valve-mask emergency narration guided instrument.  Characteristic  1–3; n=20  4; n=16
                                                                 Sex
              Respiratory Parameter Analysis
              Flow and pressure waveforms generated were analyzed using   Male           11 (55)       9 (56)
              a custom Python (version 3.7.2, Python Software Founda-  Female            9 (45)        7 (44)
              tion, Beaverton, OR) script to calculate V , RR, inspiratory   Healthcare training
                                               T
              time (t insp ), and peak inspiratory pressure (PIP) during each   Medical student  11 (55)  9 (56)
              simulated respiratory cycle (see the supplementary material   Physician    8 (40)        6 (38)
              for further information). The absolute deviation from the tar-  Physician assistant  1 (5)  1 (6)
              get V  and RR, and |ΔV | and |ΔRR|, were also calculated as    BLS-certified
                  T
                                 T
              |ΔV | = |V Ttarget  − V | and |ΔRR| = |RR target  − RR|. To evaluate   Yes  11 (55)      9 (56)
                T
                            T
              how BENGI use affected a participant’s consistency through-
              out a given test, or the intra-participant variation of delivered   No     9 (45)        7 (44)
              RR and V , the standard deviations of delivered V s and RRs   ACLS-certified
                     T
                                                     T
              during each test were calculated. Further characterization of   Yes        7 (35)        5 (31)
              the variability during a given test was done with Poincaré   No            13 (65)       11 (69)
              plots of V  and RR.  Short-term, or cycle-to-cycle, variation   BLS = basic life support; ACLS = advanced cardiovascular life support.
                              26
                      T
              (SD1) is defined as the standard deviation perpendicular to
              the line of identity. Long-term variation (SD2) is the remain-  Delivered Tidal Volumes and Respiratory Rates
              ing variation, parallel to the line of identity. Graphically,   VTs and RRs More Closely Approached Target Values
              SD1 and SD2 are shown as the minor and major axes of an    with Audiovisual Feedback
              ellipse. 27                                        Average absolute deviations from target tidal volume |ΔV |
                                                                                                                T
                                                                 were significantly reduced by BENGI (Figure 3 a–d), demon-
              Statistics                                         strating that BENGI improved participant accuracy when used
              The two-tailed  Wilcoxon signed rank test, Spearman rank   to reach target V s. Similarly, average absolute deviations of
                                                                              T
              correlation coefficient, and Mann-Whitney  U test were per-  RRs delivered to the target |ΔRR| were significantly lower with
              formed using Prism (version 9.3.1, GraphPad, San Diego, CA)   BENGI (scenarios 1–3) or the use of BENGI plus metronome
              and Levene’s test for equality of variances with SPSS (version   (scenario 4, Figure 3 e–h). Conversely, BENGI use did not alter
                                                              Enhanced Manual Ventilation with a Handheld Audiovisual Device  |  11