
Page 14 - JSOM Fall 2024
P. 14
average values of other respiratory parameters (t insp and PIP) Poincaré plots shown in Figure 5), and SD1 and SD2 variations
consistently across all scenarios (Supplementary Figure 2). were calculated to study BENGI effects on intra-participant vari-
ations. Interestingly, SD1 variations inV s were not altered with
T
TABLE 2 Levene’s Test Results for Inter-participant Variation BENGI use in scenarios 1–3 (Figure 6 a–c) but were significantly
Scenario 1; Scenario 2; Scenario 3; Scenario 4; reduced in scenario 4 (Figure 6 d). V SD2 variations were sig-
T
Measurement n=20 n=20 n=20 n=16 nificantly lower in all scenarios (Figure 6 e–h). Conversely, the
V 22.8* 29.7* 33.9* 17.1* use of BENGI significantly decreased RR SD1 variations in sce-
T
RR 10.5 † 13.2* 17.4* 15.3* narios 1–3 (Figure 6 i–k) but the variations remained unchanged
1.3 (P=.25) 1.3 (P=.26) 3.0 (P=.09) 3.8 (P=.06) in scenario 4 (Figure 6 l). RR SD2 variations were also signifi-
t insp cantly reduced in all scenarios (Figures 6 m–p).
PIP 20.4* 8.3 † 32.1* 7.2 ‡
A higher value represents a greater difference in variance be-
tween the distributions. Target V /RR for each scenario were sce- Discussion
T
−1
nario 1 (500mL/10min ), scenario 2 (750mL/10min ), scenario 3
−1
(300mL/10min ), and scenario 4 (20mL/60min ). In this study, we explored how BENGI audiovisual feedback
−1
−1
*P<.001). improves manual ventilation, spanning adult, pediatric, and
† P<.01. neonatal scenarios. We found that BENGI use improved the
‡P<.05. accuracy and consistency of manual ventilation. Additionally,
PIP = peak inspiratory pressure; RR = respiratory rate; V = tidal volume.
T reduced inter- and intra-participant variations show improved
consistency and reliability of ventilation.
Audiovisual Feedback Reduced Inter- and
Intra-participant Variation in Manual Ventilation Poincaré plot analysis has previously been used to study tem-
Levene’s test for equality of variances was performed to iden- poral variations in other physiological measurements. 26–30 To
tify differences in inter-participant variation between average our knowledge, this has not been applied to manual ventila-
respiratory parameters measured between manual ventilation tion. Here, BENGI training decreased SD2 V and RR vari-
T
with and without BENGI use. Interestingly, with BENGI use, ations in all scenarios. SD1 V variations were reduced in
T
across all measured respiratory parameters besides t insp (V , RR, scenario 4 but not in scenarios 1–3. We suspect that V SD1
T
T
and PIP), significant differences (specifically, reductions) in in- was reduced in scenario 4 because the approximate ratio of
ter-participant variation were found for all scenarios (Table 2). bag volume to V (10:1) was at least twice the ratios found
T
in scenarios 1–3; so, slight alterations in bag squeezing pro-
For all scenarios, manual ventilation with the BENGI signifi- duced a greater cycle-to-cycle variation in scenario 4 that was
cantly reduced standard deviations of V (Figure 4 a-d) and RR significantly improved by BENGI use. Conversely, SD1 RR
T
(Figure 4 e-h). Poincaré plots of delivered V s and RRs for each variations decreased in scenarios 1–3 but not in scenario 4. We
T
participant during each scenario were constructed (representative suspect that RR SD1 was not different in scenario 4 because
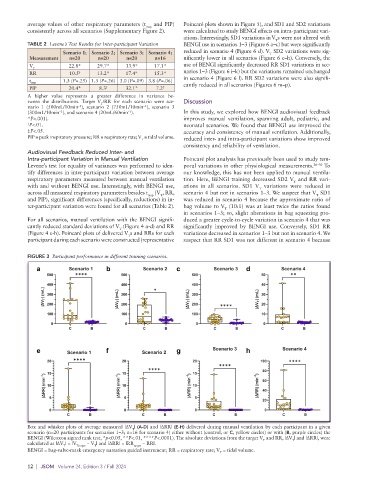
FIGURE 3 Participant performance in different training scenarios.
a Scenario 1 b Scenario 2 c Scenario 3 d Scenario 4
500 ✱✱✱✱ 500 500 50 ✱✱
400 400 ✱ 400 40
|ΔV T | (mL) 300 |ΔV T | (mL) 300 |ΔV T | (mL) 300 |ΔV T | (mL) 30
20
200
200
200
100 100 100 ✱✱✱✱ 10
0 0 0 0
C B C B C B C B
e Scenario 1 f Scenario 2 g Scenario 3 h Scenario 4
20 ✱✱✱✱ 20 20 100 ✱✱✱✱
✱✱✱✱
✱✱✱✱ 80
15 15 15
|ΔRR| (min -1 ) 10 |ΔRR| (min -1 ) 10 |ΔRR| (min -1 ) 10 |ΔRR| (min -1 ) 60
40
5
5
5
20
0 0 0 0
C B C B C B C B
Box and whisker plots of average measured |ΔV | (A-D) and |ΔRR| (E-H) delivered during manual ventilation by each participant in a given
T
scenario (n=20 participants for scenarios 1–3; n=16 for scenario 4) either without (control, or C, yellow circles) or with (B, purple circles) the
BENGI (Wilcoxon signed rank test, *p<0.05, **P<.01, ****P<.0001). The absolute deviations from the target V and RR, |ΔV | and |ΔRR|, were
T
T
calculated as |ΔV | = |V Ttarget − V | and |ΔRR| = |RR target − RR|.
T
T
BENGI = bag-valve-mask emergency narration guided instrument; RR = respiratory rate; V = tidal volume.
T
12 | JSOM Volume 24, Edition 3 / Fall 2024