
Page 57 - JSOM Summer 2024
P. 57
Environmental Noise Exposure entry are summarized in Figure 6 and identify Positive and
The number of loud noise exposures was higher in the 1st Recon Negative Affect, Resilience, Satisfaction with Life, Grit, Emo-
Bn Marines but showed significant variability (Figure 3n). The tion Regulation, Depression, Anxiety, and PTSD scales. For
majority of sound exposure was within conversational ranges. both groups, Positive Affect dominated Negative Affect, with
nearly twice the number of individuals with positive affect as
Sleep their dominant mood. Resilience scales, measuring the ability
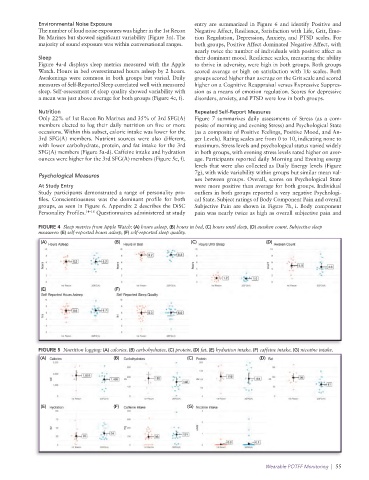
Figure 4a-d displays sleep metrics measured with the Apple to thrive in adversity, were high in both groups. Both groups
Watch. Hours in bed overestimated hours asleep by 2 hours. scored average or high on satisfaction with life scales. Both
Awakenings were common in both groups but varied. Daily groups scored higher than average on the Grit scale and scored
measures of Self-Reported Sleep correlated well with measured higher on a Cognitive Reappraisal versus Expressive Suppres-
sleep. Self-assessment of sleep quality showed variability with sion as a means of emotion regulation. Scores for depressive
a mean was just above average for both groups (Figure 4e, f). disorders, anxiety, and PTSD were low in both groups.
Nutrition Repeated Self-Report Measures
Only 22% of 1st Recon Bn Marines and 35% of 3rd SFG(A) Figure 7 summarizes daily assessments of Stress (as a com-
members elected to log their daily nutrition on five or more posite of morning and evening Stress) and Psychological State
occasions. Within this subset, calorie intake was lower for the (as a composite of Positive Feelings, Positive Mood, and An-
3rd SFG(A) members. Nutrient sources were also different, ger Levels). Rating scales are from 0 to 10, indicating none to
with lower carbohydrate, protein, and fat intake for the 3rd maximum. Stress levels and psychological status varied widely
SFG(A) members (Figure 5a-d). Caffeine intake and hydration in both groups, with evening stress levels rated higher on aver-
ounces were higher for the 3rd SFG(A) members (Figure 5e, f). age. Participants reported daily Morning and Evening energy
levels that were also collected as Daily Energy levels (Figure
7g), with wide variability within groups but similar mean val-
Psychological Measures
ues between groups. Overall, scores on Psychological State
At Study Entry were more positive than average for both groups. Individual
Study participants demonstrated a range of personality pro- outliers in both groups reported a very negative Psychologi-
files. Conscientiousness was the dominant profile for both cal State. Subject ratings of Body Component Pain and overall
groups, as seen in Figure 6. Appendix 2 describes the DiSC Subjective Pain are shown in Figure 7h, i. Body component
Personality Profiles. 14–18 Questionnaires administered at study pain was nearly twice as high as overall subjective pain and
FIGURE 4 Sleep metrics from Apple Watch: (A) hours asleep, (B) hours in bed, (C) hours until sleep, (D) awaken count. Subjective sleep
measures: (E) self-reported hours asleep, (F) self-reported sleep quality.
(A) (B) (C) (D)
(E) (F)
FIGURE 5 Nutrition logging: (A) calories, (B) carbohydrates, (C) protein, (D) fat, (E) hydration intake, (F) caffeine intake, (G) nicotine intake.
(A) (B) (C) (D)
(E) (F) (G)
Wearable POTFF Monitoring | 55