
Page 56 - JSOM Summer 2024
P. 56
administer assessments of cognitive inhibition with the Stroop Individual Goals
test, reaction time with the Shake test, visual attention with the For the 1st Recon Bn Marines, improving sleep was the top
Trail Making test, spatial memory with the Spatial Span test, goal, followed by improving range of motion, improving cog-
and motor capability with the Tapping Speed test. 13 nition, and maintaining healthy nutrition. In contrast, the top
goal for the 3rd SFG(A) members was maintaining consistent
Statistical Analysis body weight, followed by improving sleep and then improving
The reported data include demographics, wearable device cognition.
data, psychological measures, subjective self-report, nutrition,
and cognitive performance. The data are presented visually by
population to show the distribution of individual values, la- Wearable Measures
beled group mean, and 95% CI error bars. Activity
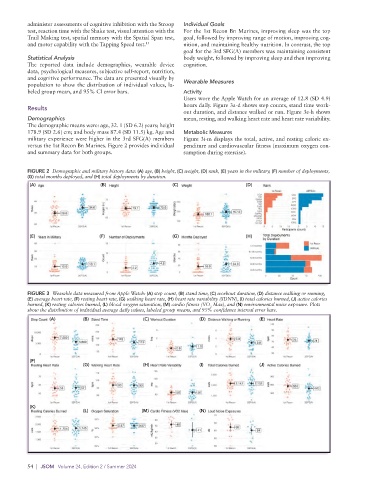
Users wore the Apple Watch for an average of 12.8 (SD 4.9)
hours daily. Figure 3a-d shows step counts, stand time work-
Results
out duration, and distance walked or run. Figure 3e-h shows
Demographics mean, resting, and walking heart rate and heart rate variability.
The demographic means were: age, 32. 1 (SD 6.2) years; height
178.9 (SD 2.6) cm; and body mass 87.4 (SD 11.5) kg. Age and Metabolic Measures
military experience were higher in the 3rd SFG(A) members Figure 3i-m displays the total, active, and resting caloric ex-
versus the 1st Recon Bn Marines. Figure 2 provides individual penditure and cardiovascular fitness (maximum oxygen con-
and summary data for both groups. sumption during exercise).
FIGURE 2 Demographic and military history data: (A) age, (B) height, (C) weight, (D) rank, (E) years in the military, (F) number of deployments,
(G) total months deployed, and (H) total deployments by duration.
(A) (B) (C) (D)
(E) (F) (G) (H)
FIGURE 3 Wearable data measured from Apple Watch: (A) step count, (B) stand time, (C) workout duration, (D) distance walking or running,
(E) average heart rate, (F) resting heart rate, (G) walking heart rate, (H) heart rate variability (SDNN), (I) total calories burned, (J) active calories
burned, (K) resting calories burned, (L) blood oxygen saturation, (M) cardio fitness (VO Max), and (N) environmental noise exposure. Plots
2
show the distribution of individual average daily values, labeled group means, and 95% confidence interval error bars.
(A) (B) (C) (D) (E)
(F)
(G) (H) (I) (J)
(K)
(L) (M) (N)
54 | JSOM Volume 24, Edition 2 / Summer 2024